Note: There is no limit to the number of any type of poster entries we can take!
Must register for the OKSCAUG Conference to submit a poster entry.


Sand Springs Community Services Michelle Mount, Michael Harrison, Tony Rongey, Trisha Robinson, Doug Wehmeyer City of Owasso, OK As part of our final research project to complete our GIS Practicum at Tulsa Community College, the authors worked with Sand Springs Community Services to analyze the data collected as they served their clients. The team looked at financial assistance and its distribution across the service area. Our second area of focus was in looking at client demographics and the in area and out of area assistance they provided. The poster give a small snapshot of the analysis and maps we produced.
| Determining Fire Severity of the Santa Rosa, CA 2017 Fire John W. Cortenbach - Humboldt State University Department of Environmental Science and Management Richard J. Williams - Humboldt State University Environmental Resources Engineering Buddhika D. Madurapperuma - Humboldt State University Department of Forestry and Wildland Resources This study examines the 2017 Santa Rosa wildfire using remote sensing techniques to estimate the acreage of burned areas. Landsat 8 imagery of the pre- and post-fire areas was used to extrapolate the burn severity using two methods: (i) difference Normalized Burn Ratio (dNBR) and (ii) change detection analysis. We compared our analyses with data provided by the California Department of Forestry and Fire Protection (Cal Fire). The results of burn severity using both methods were on average 24% under-approximated in comparison to Cal Fire values. When comparing our acreage burn analysis to Cal Fire data, our results were on average 76 ± 8% accurate in identifying burn severity. Of the two methods, the change detection using an iso-clustered unsupervised classification scheme was more accurate. Landsat-based burn severity mapping provides cost–effective tools for forest managers to identify fire risk areas for wildfire planning and ecosystem management.
| Air Pollution in Texas: Locked down by COVID-19 Abhishek K. Kala*, Samuel F. Atkinson, Chetan Tiwari University of North Texas, Advanced Environmental Research Institute, University of North Texas, Denton, TX Air is one of the critical natural resources that is vital for human health. In the U.S., poor air quality is the cause of around 60,000 premature deaths annually and over $150 billion in costs related to air pollution-driven illnesses. The outbreak of pandemic COVID‐19 has caused tremendous impacts on public health and economy across the world leading to strict lock down measures to reduce its spread. The silver lining of this tragic outbreak is the improvement in air quality in many areas as a result of an unprecedented reduction in global economic and transportation activities. In this study we examined the changes in the concentration of nitrogen dioxide (a useful proxy for human activities) for the state of Texas. We utilized freely available datasets and ran our analysis using the open source Google Earth Engine platform. It is evident that the counties in Texas experienced improvement in air quality during the lock down period.
|
Uncovering the hidden patterns in complex epidemiological datasets Abhishek K. Kala*, Samuel F. Atkinson, Chetan Tiwari Tessellations Inc. This study postulates that underlying environmental conditions and a susceptible population’s socio-economic status should be explored simultaneously to adequately understand a vector borne disease infection risk. Here we focus on West Nile Virus, a mosquito borne pathogen, as a case study for spatial data visualization of environmental characteristics of a vector’s habitat alongside human demographic composition for understanding potential public health risks. We propose that the use of geovisualization tools may provide a glimpse into the large number of potential variables influencing the disease and help distill them into a smaller number that might reveal hidden patterns. This geovisual look at the data might then guide development of analytical models that can combine environmental and socio-economic data. Our results suggest that simultaneously visualizing these datasets supports a fuller understanding of the underlying spatial processes for risks to vector-borne disease.
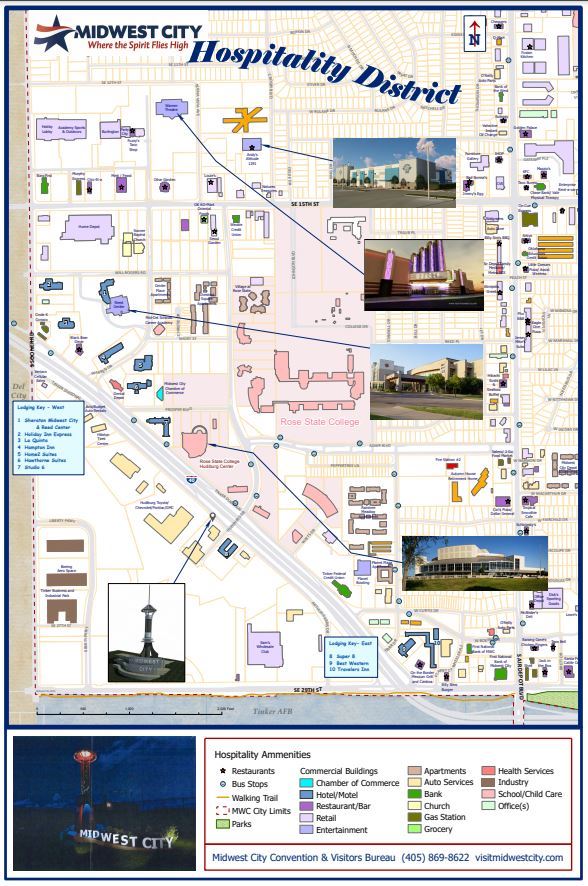
| The Hospitality District of Midwest City Marianna Sikkar City of Midwest City, OK A poster-sized (2'x3') map developed for the Convention/Tourism Manager to emphasize the lodging, convention and entertainment venues, and restaurants in the Hospitality District of the City of Midwest City. It was created using ArcGIS Pro.
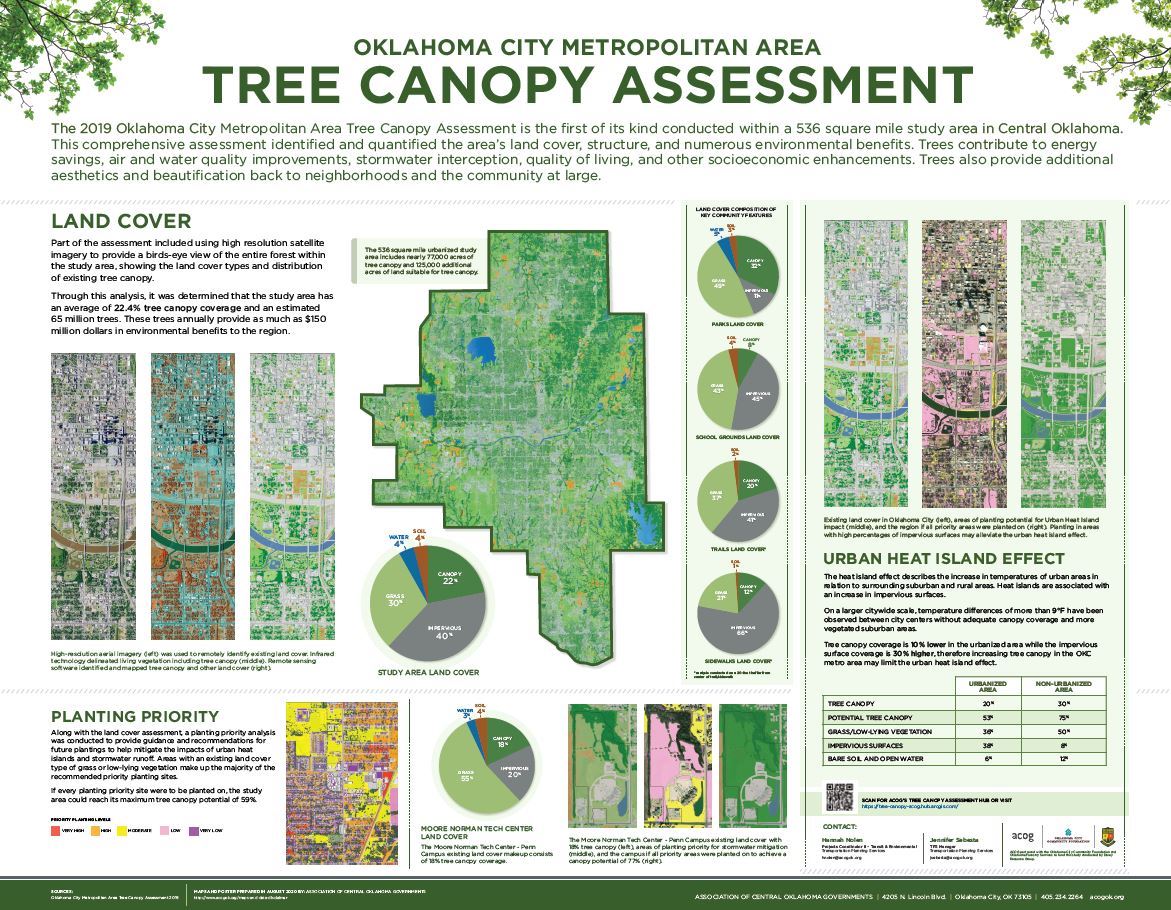
| Oklahoma City Metropolitan Area Tree Canopy Assessment Hannah Nolen Association of Central Oklahoma Governments (ACOG) The Oklahoma City Metropolitan Area Tree Canopy Assessment was the first of its kind conducted within a 536 square mile study area in the central part of the state of Oklahoma. The comprehensive assessment identified and quantified the area's land cover, structure, and numerous environmental benefits. Trees contribute to energy savings, air and water quality improvements, stormwater interception, quality of living, and other socioeconomic enhancements. Trees also provide aesthetics and beautification back to neighborhoods and the community at large.
|
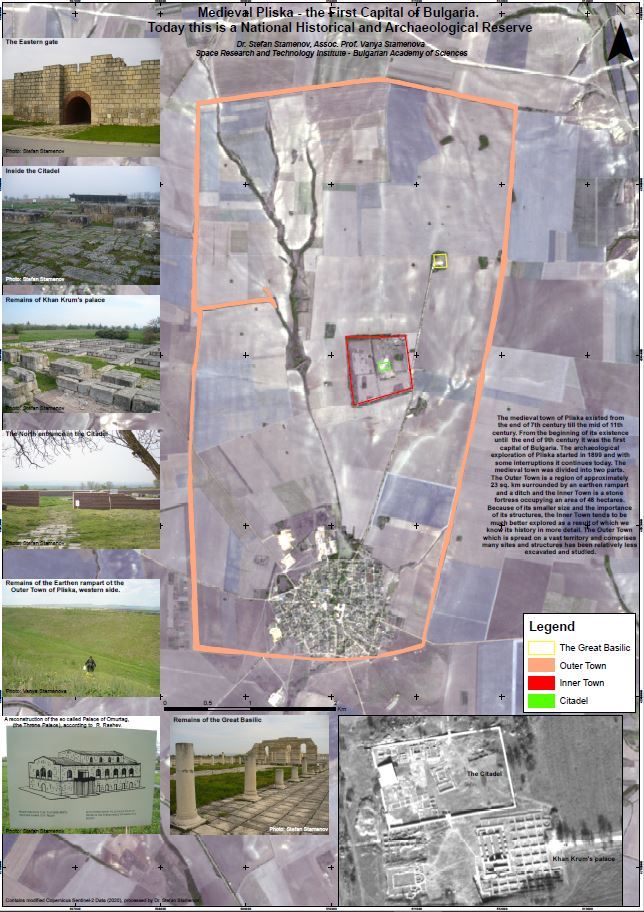
Stefan Stamenov, Vanya Stamenova Space Research and Technology Institute - Bulgarian Academy of Sciences (SRTI-BAS) The medieval town of Pliska existed from the end of 7th century till the mid of 11th century. From the beginning of its existence until the end of 9th century it was the first capital of Bulgaria. The archaeological exploration of Pliska started in 1899 and with some interruptions it continues today. The medieval town was divided into two parts. The Outer Town is a region of approximately 23 sq. km surrounded by an Earthen rampart and a ditch and the Inner Town is a stone fortress occupying an area of 48 hectares. Because of its smaller size and the importance of its structures, the Inner Town tends to be much better explored as a result of which we know its history in more detail. The Outer Town which is spread on a vast territory and comprises many sites and structures has been relatively less excavated and studied.
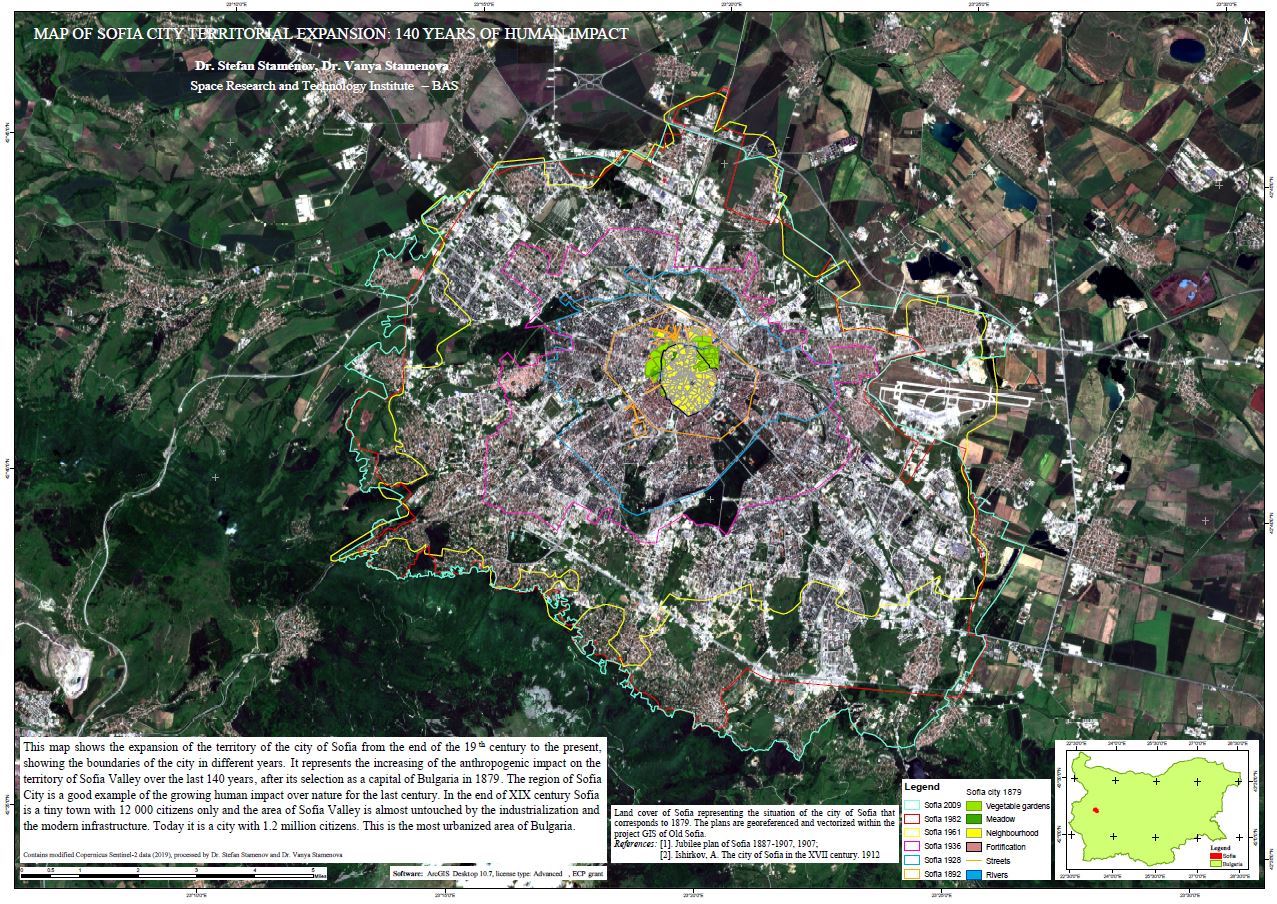
| Map of Sofia City territorial expansion: 140 years of human impact Stefan Stamenov, Vanya Stamenova Space Research and Technology Institute - Bulgarian Academy of Sciences (SRTI-BAS) This map shows the expansion of the territory of the city of Sofia from the end of the 19th century to the present, showing the boundaries of the city in different years. It represents the increasing of the anthropogenic impact on the territory of Sofia Valley over the last 140 years, after its selection as a capital of Bulgaria in 1879. The region of Sofia City is a good example of the growing human impact over nature for the last century. In the end of XIX century Sofia is a tiny town with 12 000 citizens only and the area of Sofia Valley is almost untouched by the industrialization and the modern infrastructure. Today it is a city with 1.2 million citizens. This is the most urbanized area of Bulgaria.
|


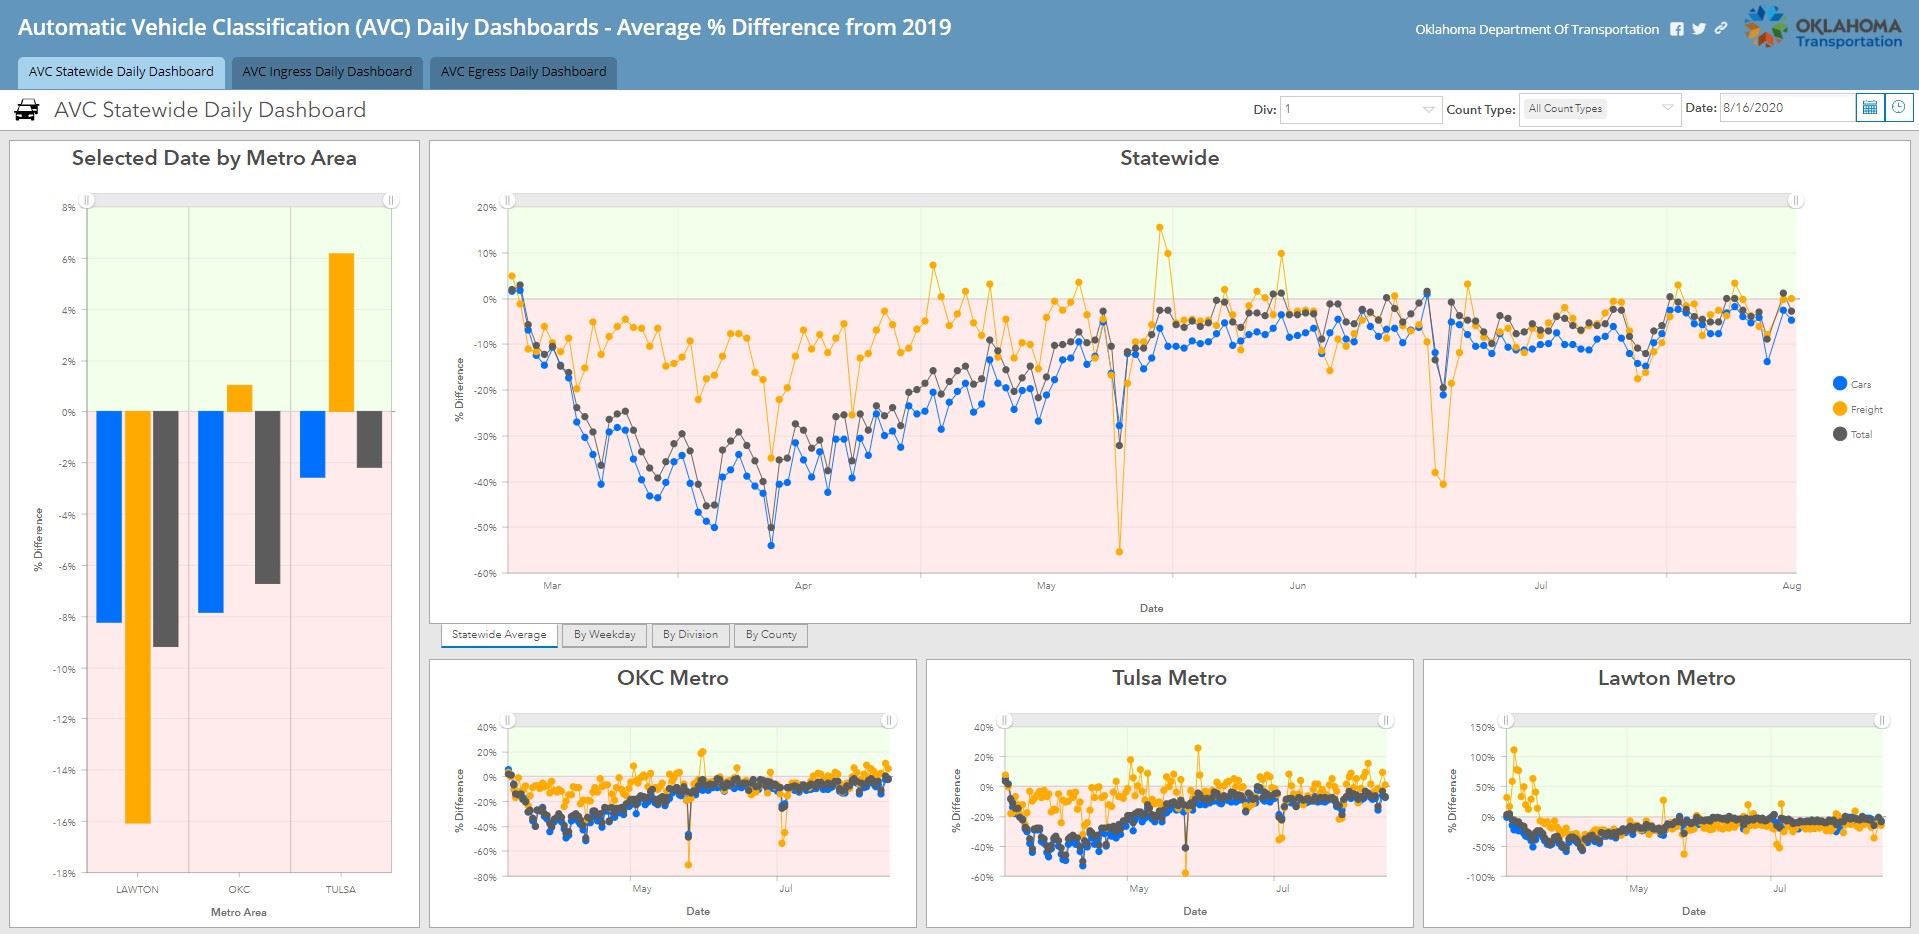
Average Percent AADT Difference from 2019 Gwendolyn Johnson - Oklahoma Department of Transportation Due to COVID-19 and the subsequent Stay-At-Home orders the Oklahoma Department of Transportation (ODOT) knew the state Average Annual Daily Traffic (AADT) counts would be affected this year. This web app shows the collection of Dashboards created by ODOT's GIS branch to show how the traffic counts compared to the average counts from 2019. This analysis will help ODOT's senior staff and the Governor's office see the how traffic counts are affected by the pandemic, as well as determine how this will affect the state's reporting to the Federal Highway Administration in 2020.
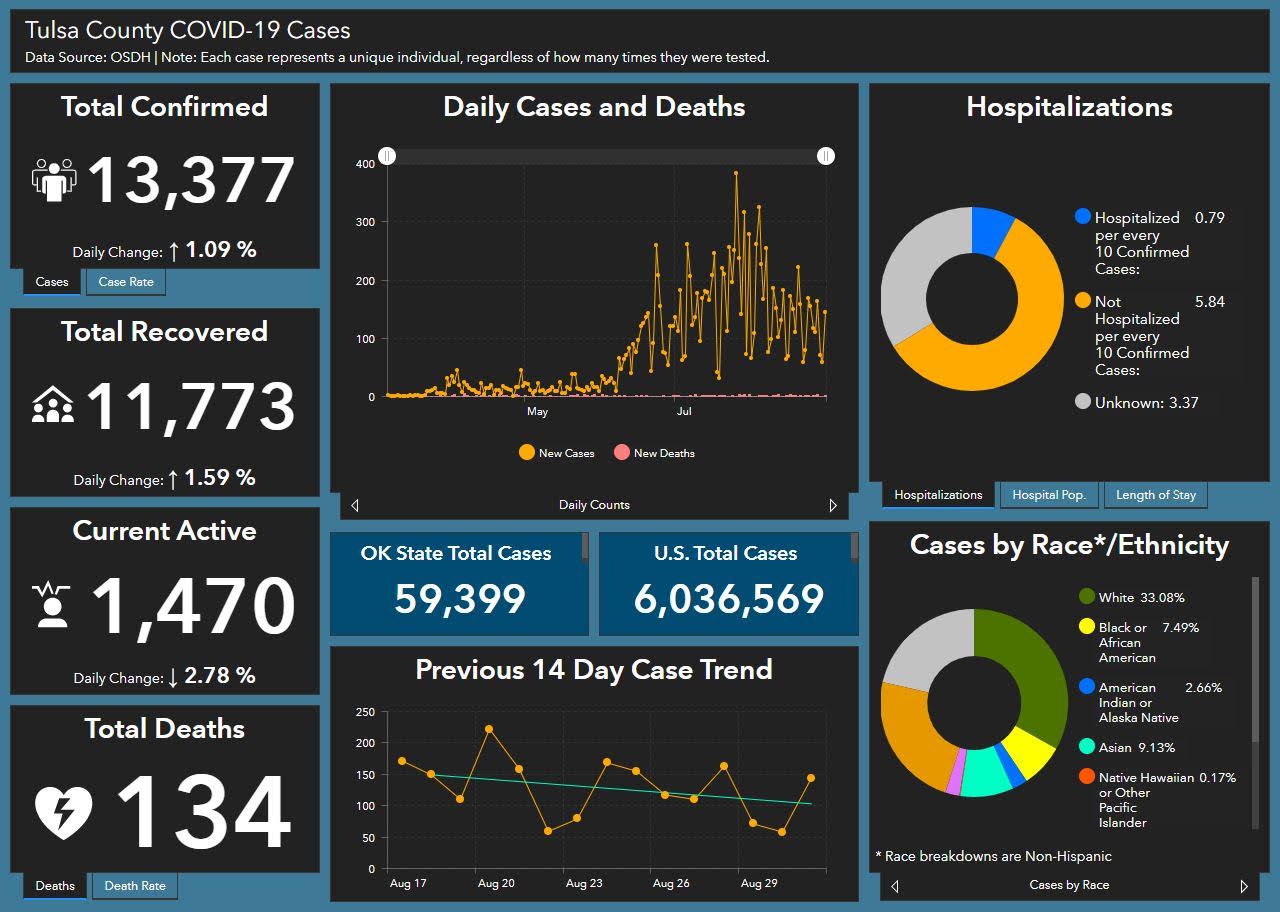
| Tulsa County COVID-19 Data Dashboard Kiran Duggirala - Tulsa Health Department This dashboard was developed in ArcGIS Online to share Tulsa County COVID19 data to the public. This dashboard hosts total of 26 data panels at this point of time and may grow based on future data needs.
| Marcus Arreguin - City of Longview, TX The Longview Transit App has been featured in the Esri UC Plenary Session for the last two years. To give some background on the project, Longview Transit serves the city of Longview with bus and paratransit services. Longview Transit operates six routes that cover most of the city of Longview and run six days a week. In 2017, I began updating our data on the bus routes and stops, utilizing information from Longview Transit, remote sensing, and field verification. I used this data to create a web app in 2018 that shows bus users the routes, stops, and pop-ups related to the stops and gives directions to or from bus stops. The app also helps Longview Transit with planning route and stop modifications. Recently, Longview Transit has made extensive changes to its routes, and I have implemented updates to the data and web app, at the same time enhancing the app. Users of the app can now see published bus arrival times labeled on the stops to better help them plan their commutes.
|
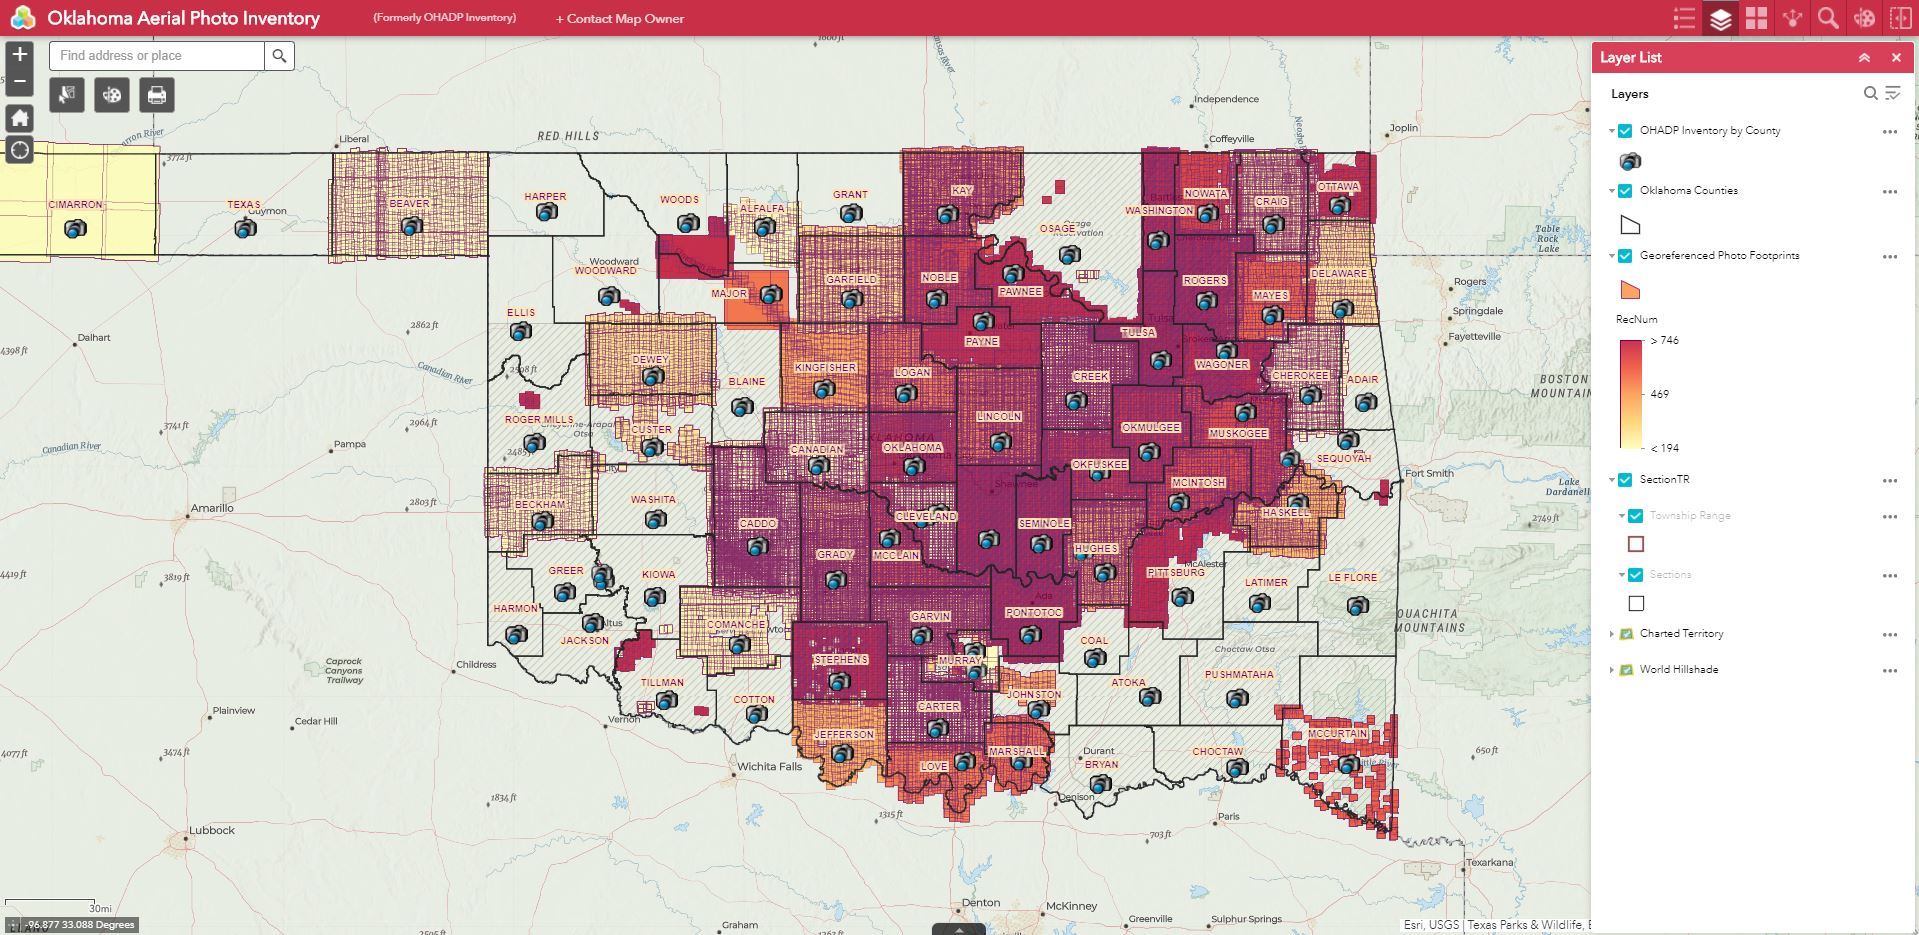
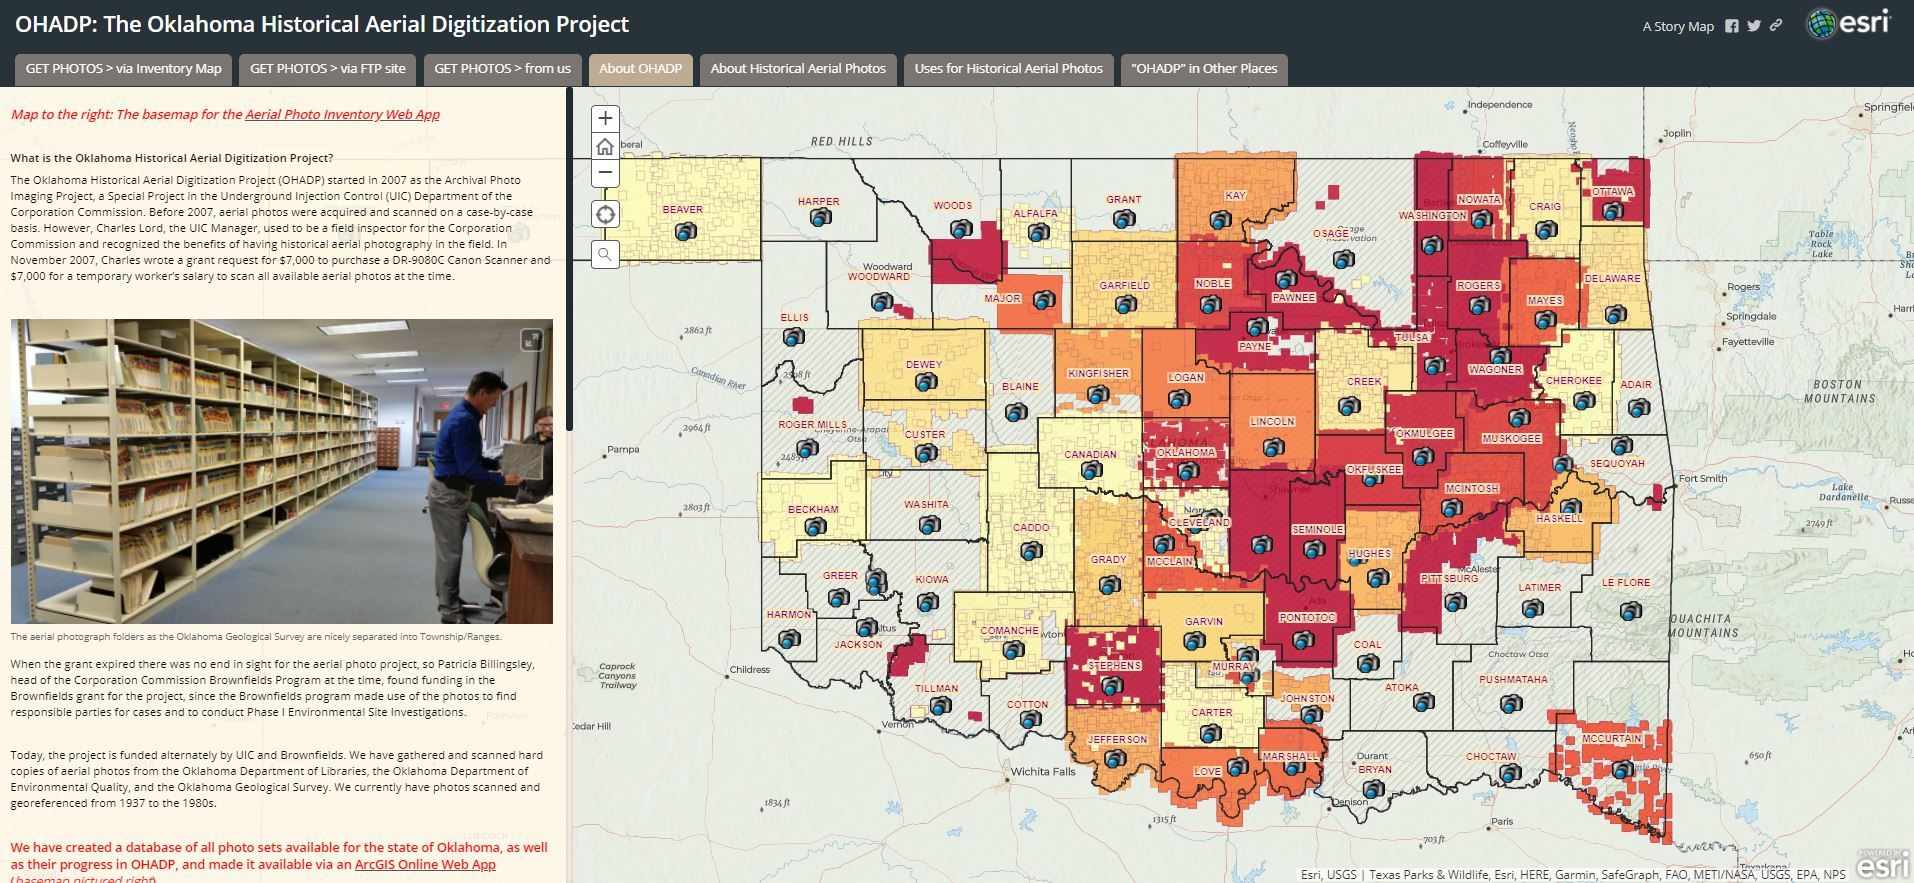
The Oklahoma Historical Aerial Photo Inventory Web App Madeline Dillner Oklahoma Corporation Commission Brownfield Program The OCC has georeferenced thousands of historical aerial photographs for the state of Oklahoma. We use these photos in-house for Phase I Environemental Site Assessments and environmental case research. We have also given our georeferenced photos to OKMaps to host of their FTP site, and built this web app that has the footprints of georeferenced photos and links to the files on the FTP site. This web app is accessible to the public and has been accessed 3,266 times in the past year alone. Note: Madeline is an OKSCAUG Steering Committee member and is not eligible to win, but she loves her job and is proud of the products her program has created!
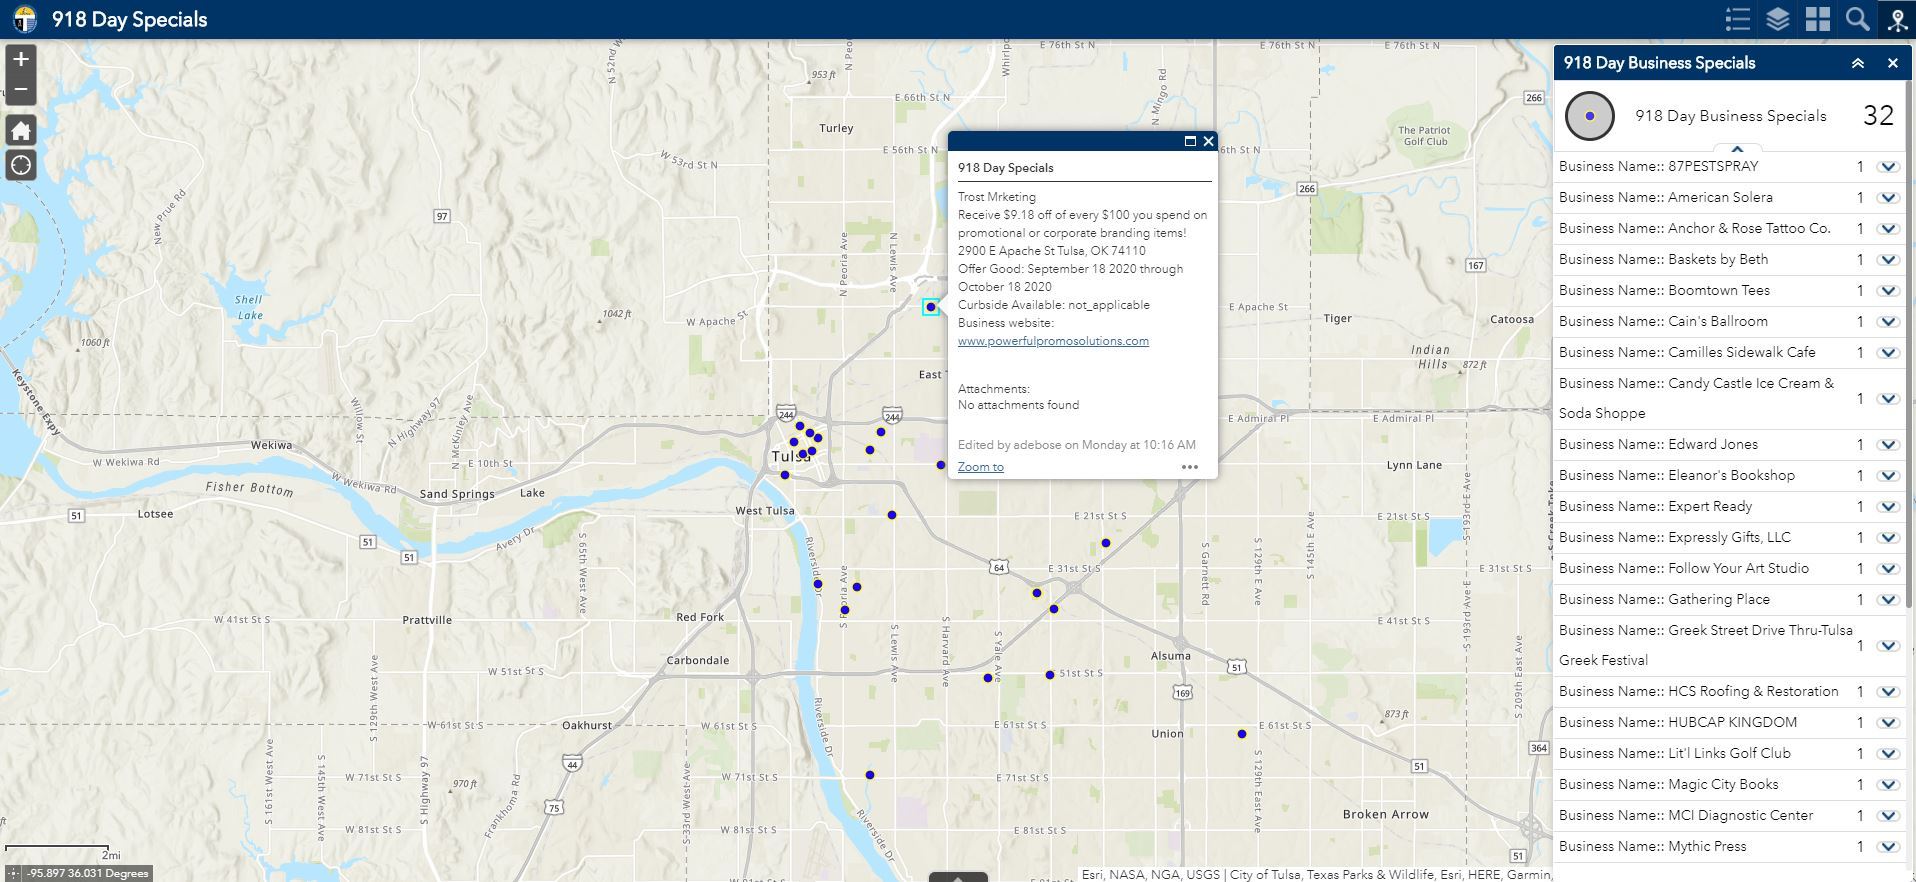
| Chaya Balsiger City of Tulsa GIS Services This is an application created for the public to view the specials offered by businesses for 918 day in Tulsa. A survey using Survey123 was created for the businesses to submit their information, including business name, description of the special, a photo to show what the special was and location of the business. An internal editor application was created for quality control over the submitted surveys before it was shown on the public web application.
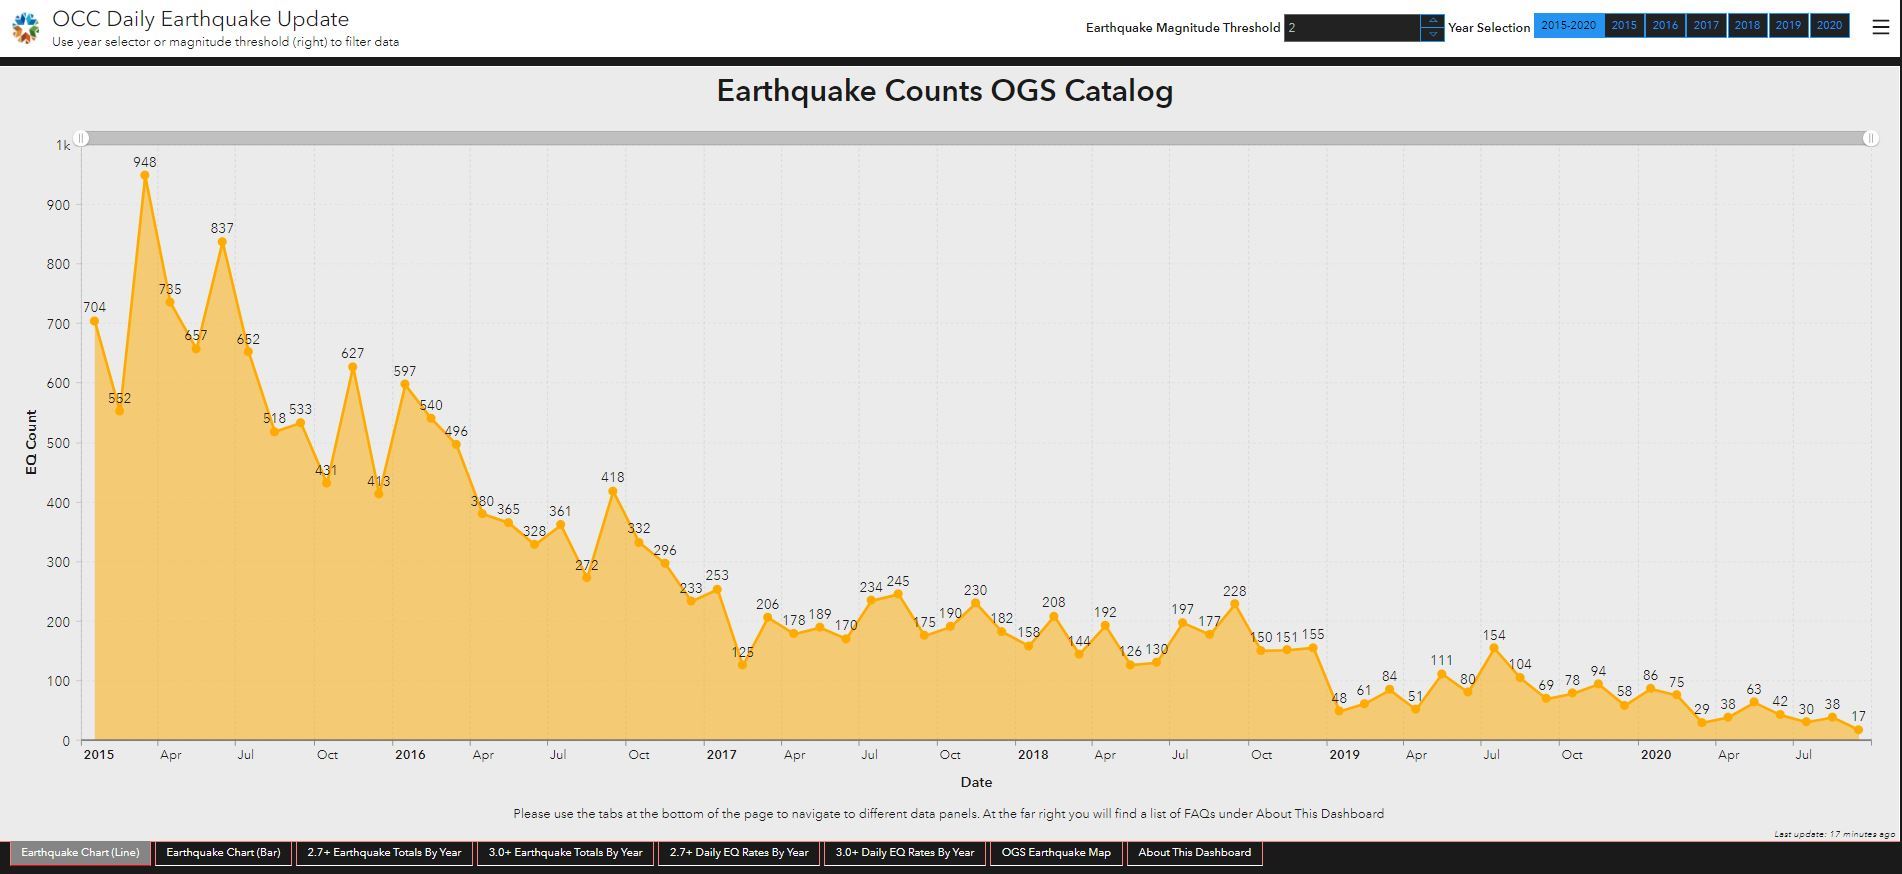
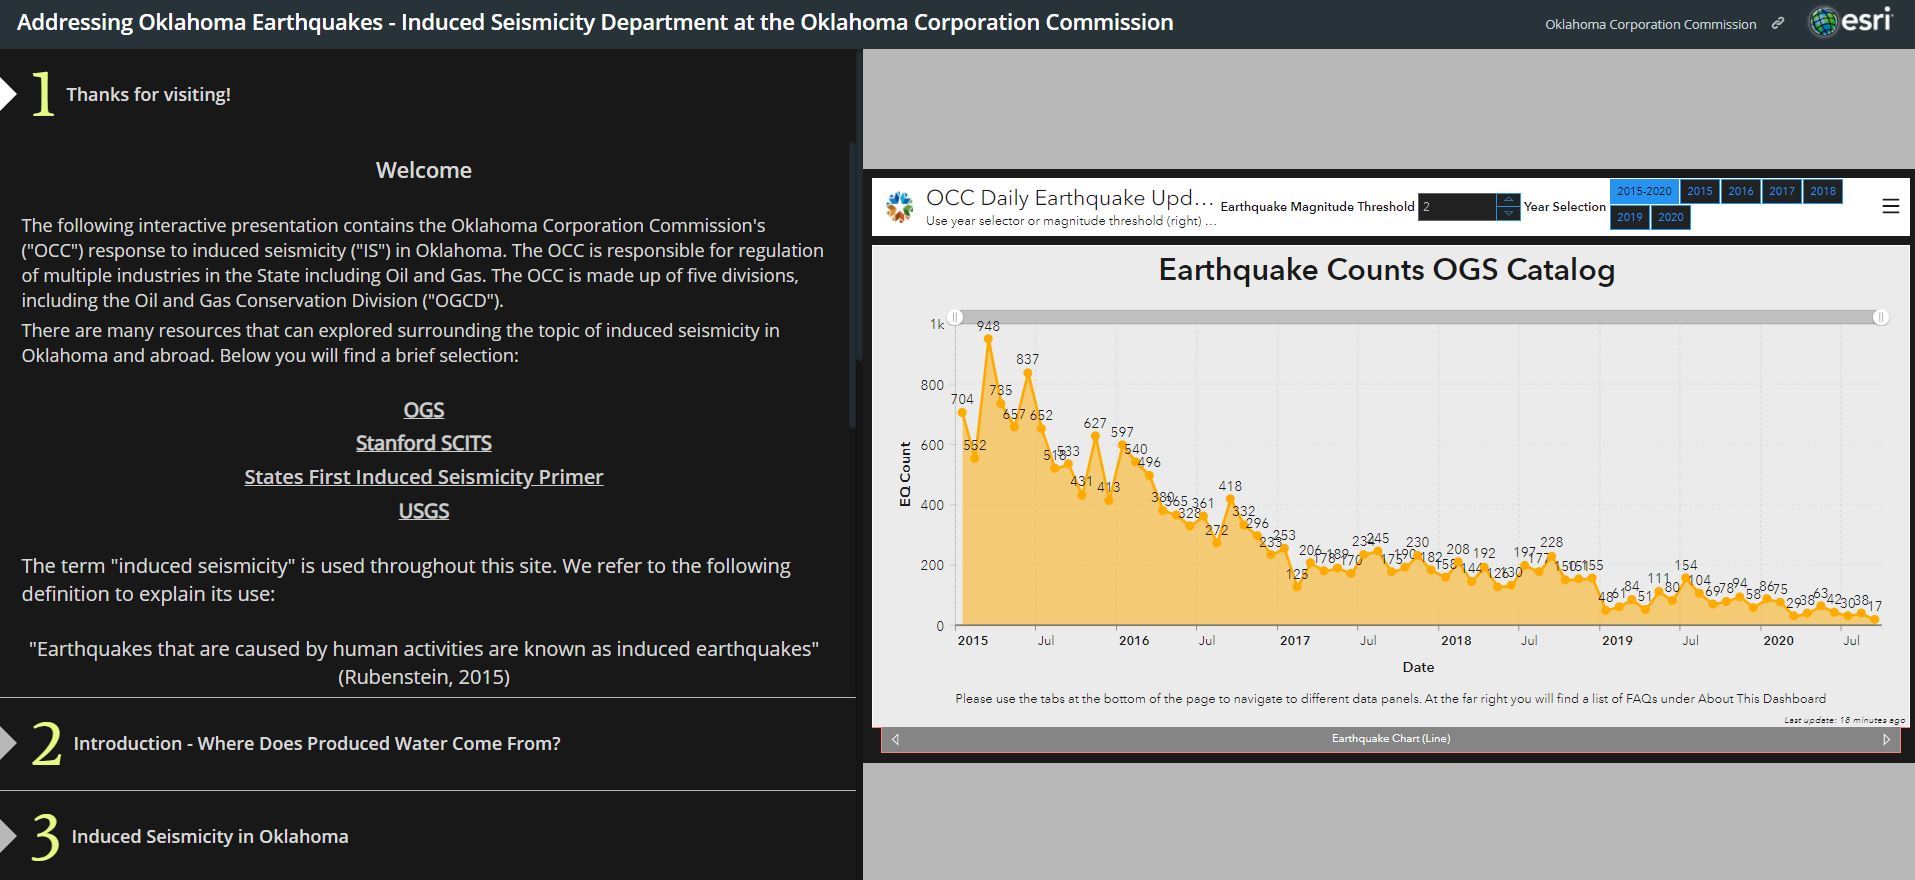
| Colin Brooks Oklahoma Corporation Commission Induced Seismicity Department This Operations Dashboard shows various statistics relating to seismicity in Oklahoma since 2015.
|


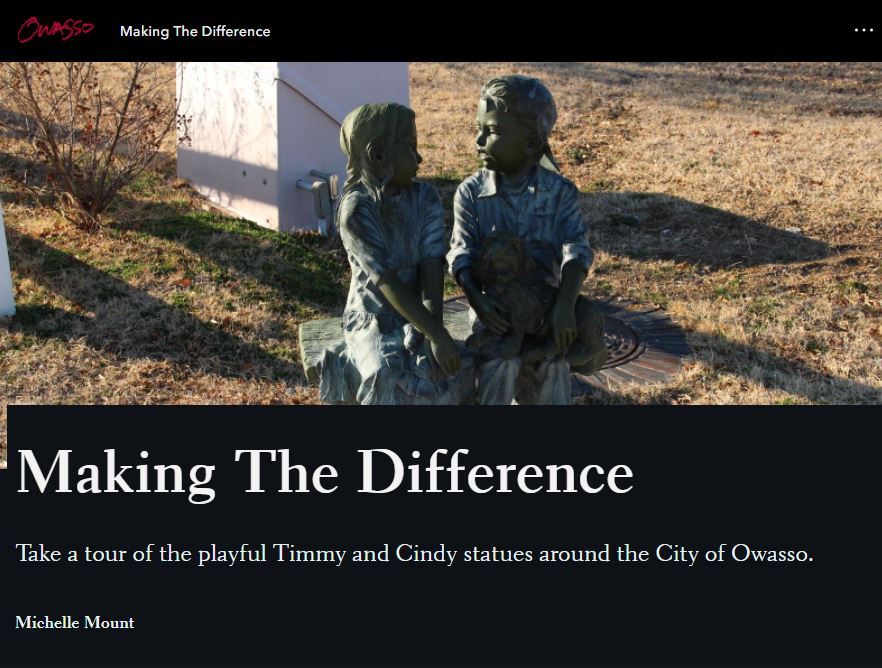
Michelle Mount City of Owasso, OK A tour story map of the Timmy and Cindy art statues locations around the City of Owasso, Oklahoma. Timmy and Cindy casting are part of the public arts initiative of the Department of Recreation and Culture.
| Higher Education in Tulsa County - A Look at College Enrollment and Educational Attainment Ty Simmons INCOG This story map provides a series of maps and charts showing college enrollment in Tulsa CouHigher Education in Tulsa County - A Look at College Enrollment and Educational Attainmentnty by age, race, ethnicity, and income. The story map also takes a look at educational attainment in the county by race and ethnicity. This story map was created by INCOG for the Tulsa Education Task Force whose goal is to develop a "plan for a formal structure that will leverage shared institutional resources and facilitate a seamless academic and social experience for students pursing baccalaureate degrees in the Tulsa region."
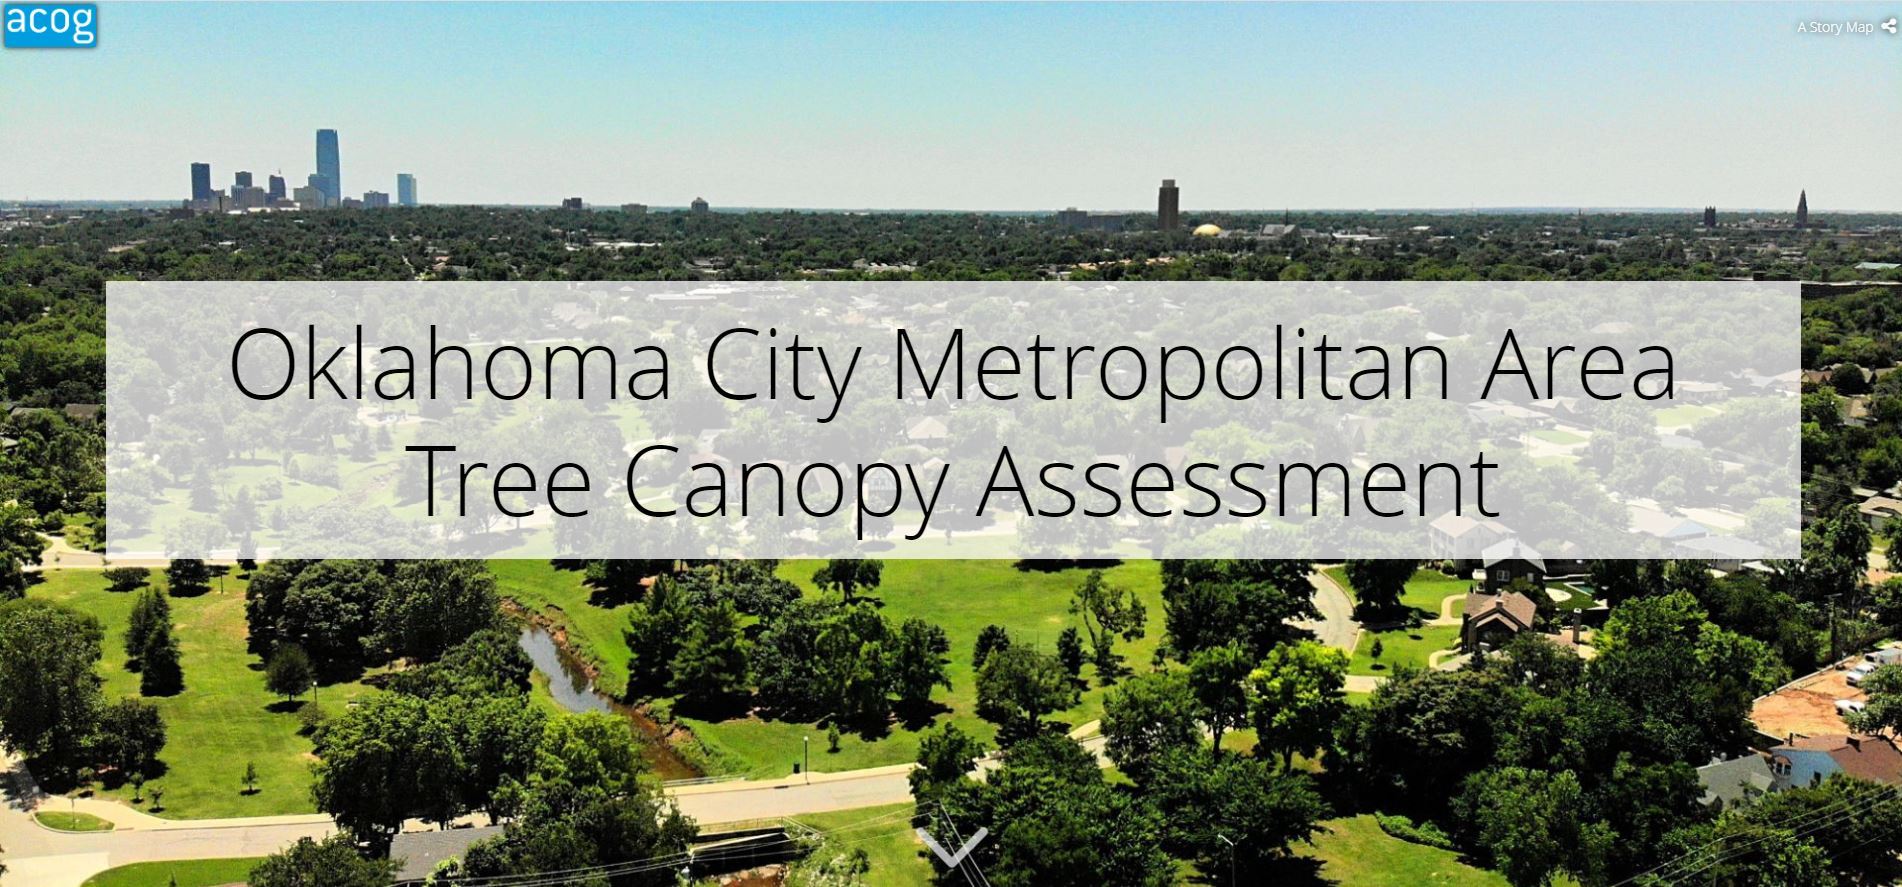
| Oklahoma City Metropolitan Area Tree Canopy Assessment Story Map Hannah Nolen Association of Central Oklahoma Governments (ACOG) This story map explores the results of the Oklahoma City Metropolitan Area Tree Canopy Assessment of 2019. The tree canopy assessment was the first of its kind conducted within a 536 square mile study area in the central part of the state of Oklahoma. Understanding the location, makeup, and extent of the forest canopy contained in this area is key to developing and implementing sound management strategies that promote the sustainability and growth of the study area’s forest resource and the benefits it provides. The comprehensive assessment identified and quantified the area's land cover, structure, and numerous environmental benefits. Trees contribute to energy savings, air and water quality improvements, stormwater interception, quality of living, and other socioeconomic enhancements. Trees also provide aesthetics and beautification back to neighborhoods and the community at large.
|
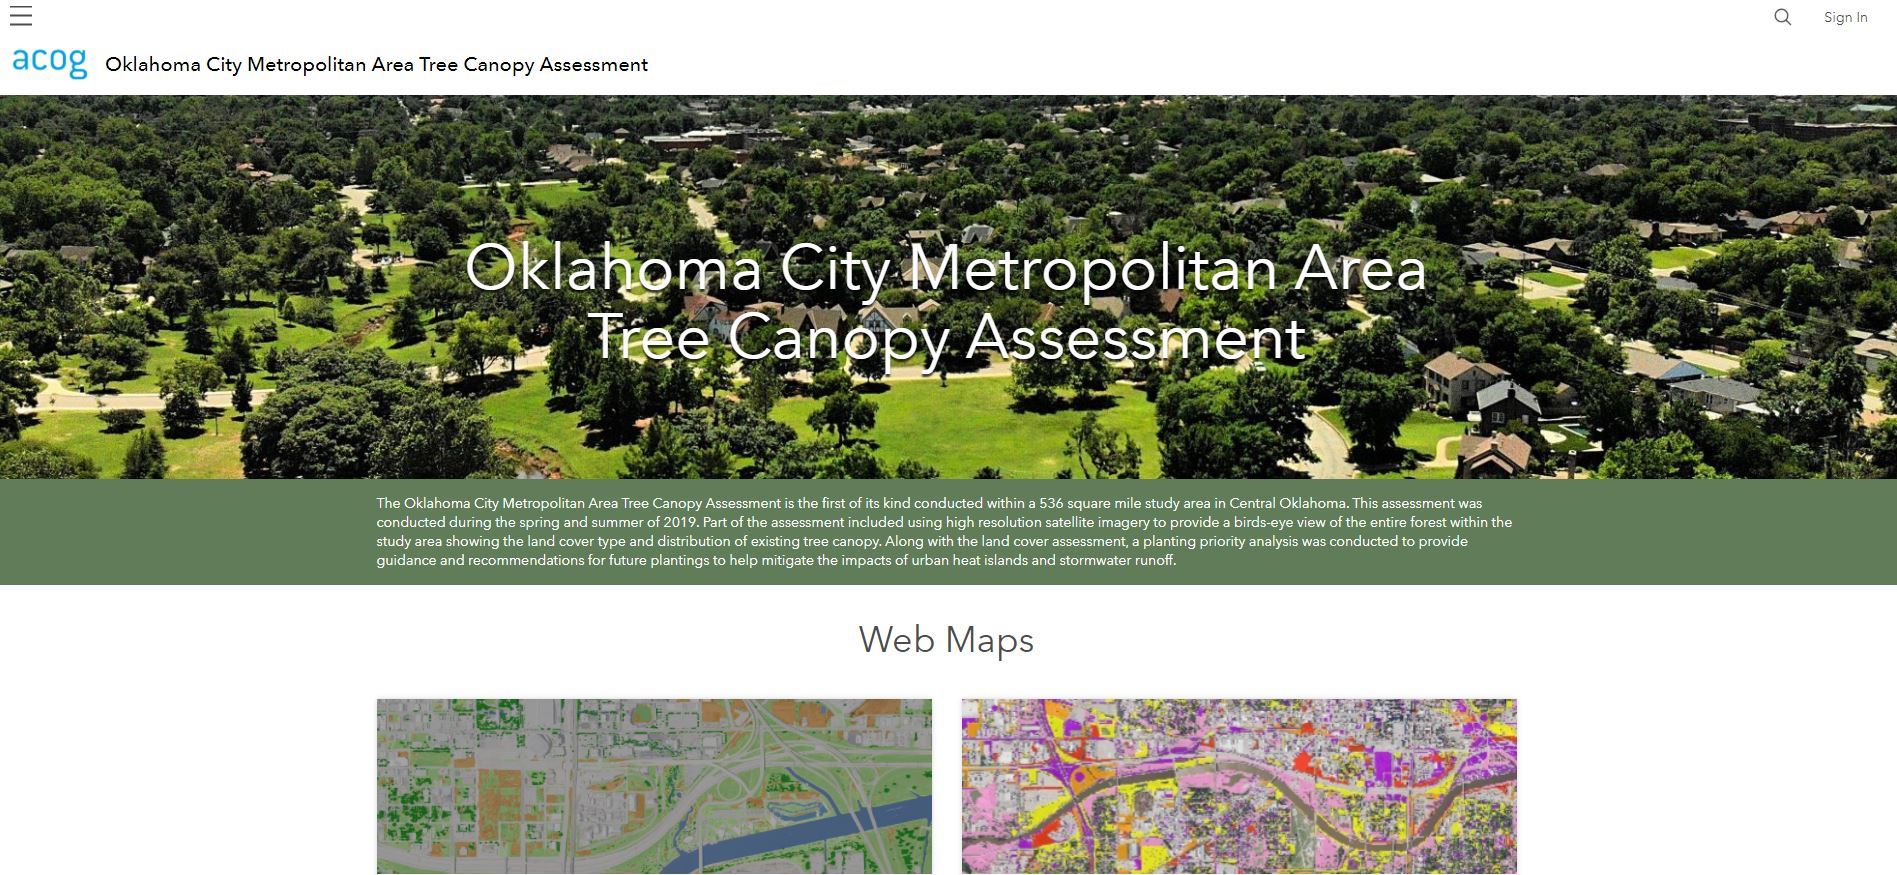
Oklahoma City Metropolitan Area Tree Canopy Assessment Hub Hannah Nolen Association of Central Oklahoma Governments (ACOG) This hub site includes web maps, reports and documents, data available to download, and more resources related to the 2019 Oklahoma City Metropolitan Area Tree Canopy Assessment. The Oklahoma City Metropolitan Area Tree Canopy Assessment was the first of its kind conducted within a 536 square mile study area in Central Oklahoma. This assessment was conducted during the spring and summer of 2019. Part of the assessment included using high resolution satellite imagery to provide a birds-eye view of the entire forest within the study area showing the land cover type and distribution of existing tree canopy. Along with the land cover assessment, a planting priority analysis was conducted to provide guidance and recommendations for future plantings to help mitigate the impacts of urban heat islands and stormwater runoff.
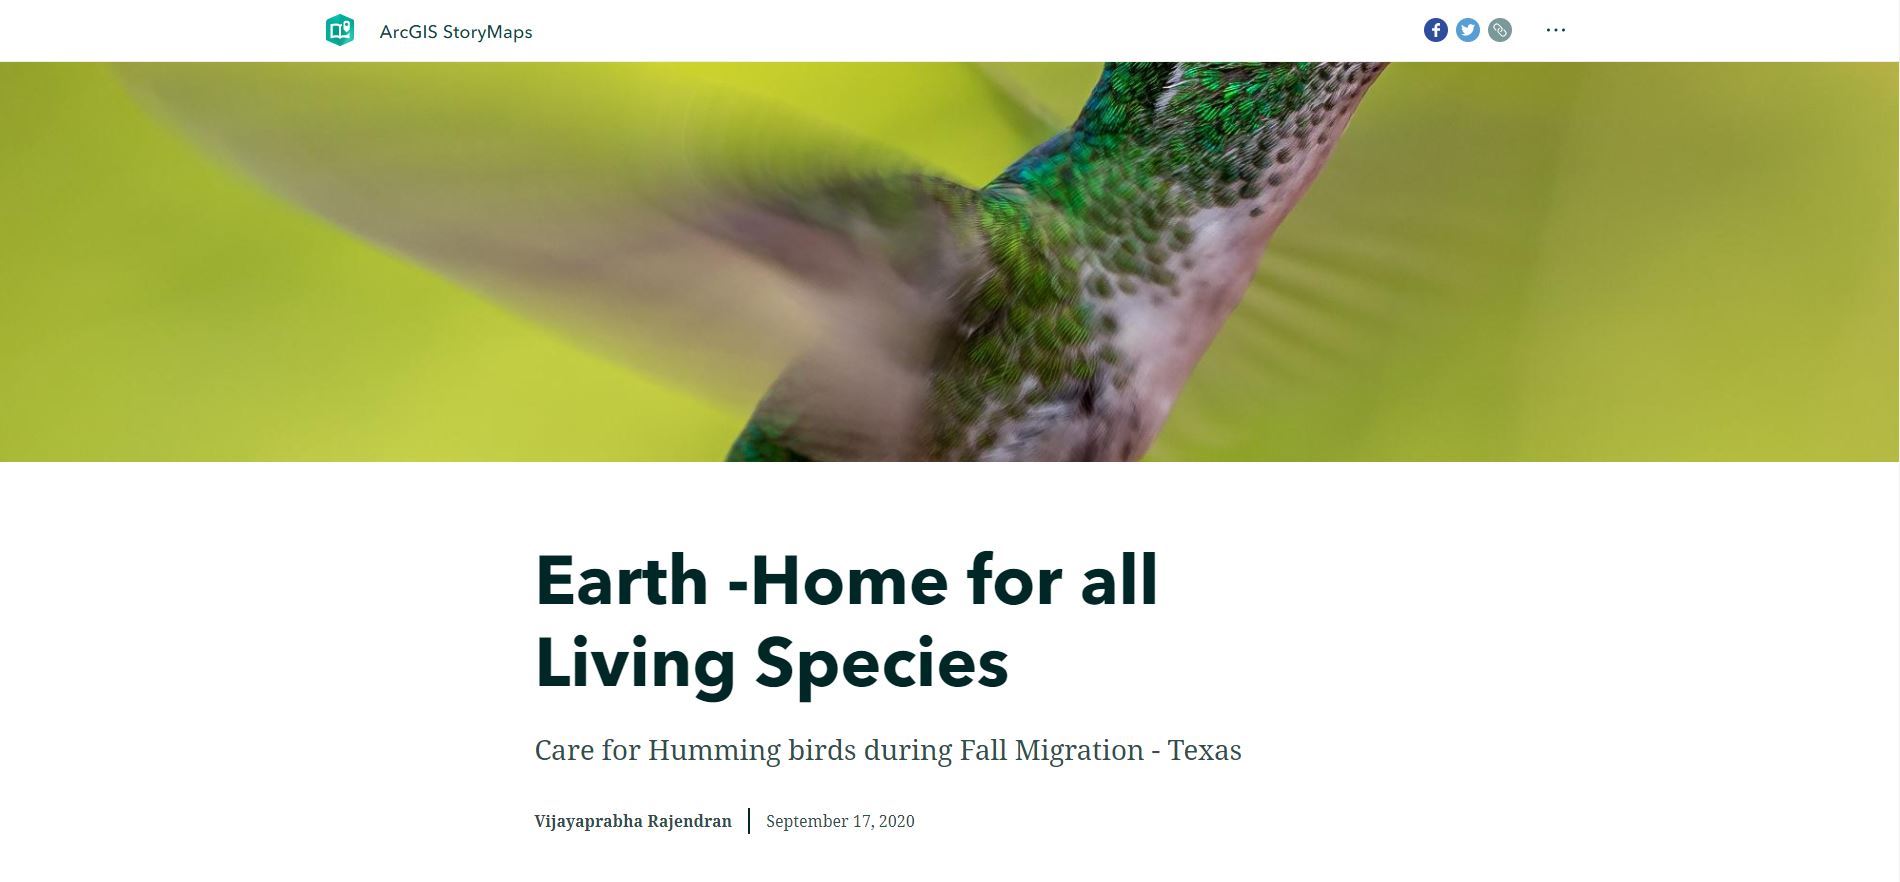
| Earth -Home for all Living Species Vijayaprabha Rajendran Humming birds migrate during fall from north to South every year to avoid harsh winter. During this migration journey humming birds face lots of hardship both from nature and humans. By taking small steps and following some precautionary measures we can not only help these birds but save them. This story map provides some facts about the humming birds, fall migration and explains some dangers faced by it. Finally provides some simple measures to help the bird during migration.
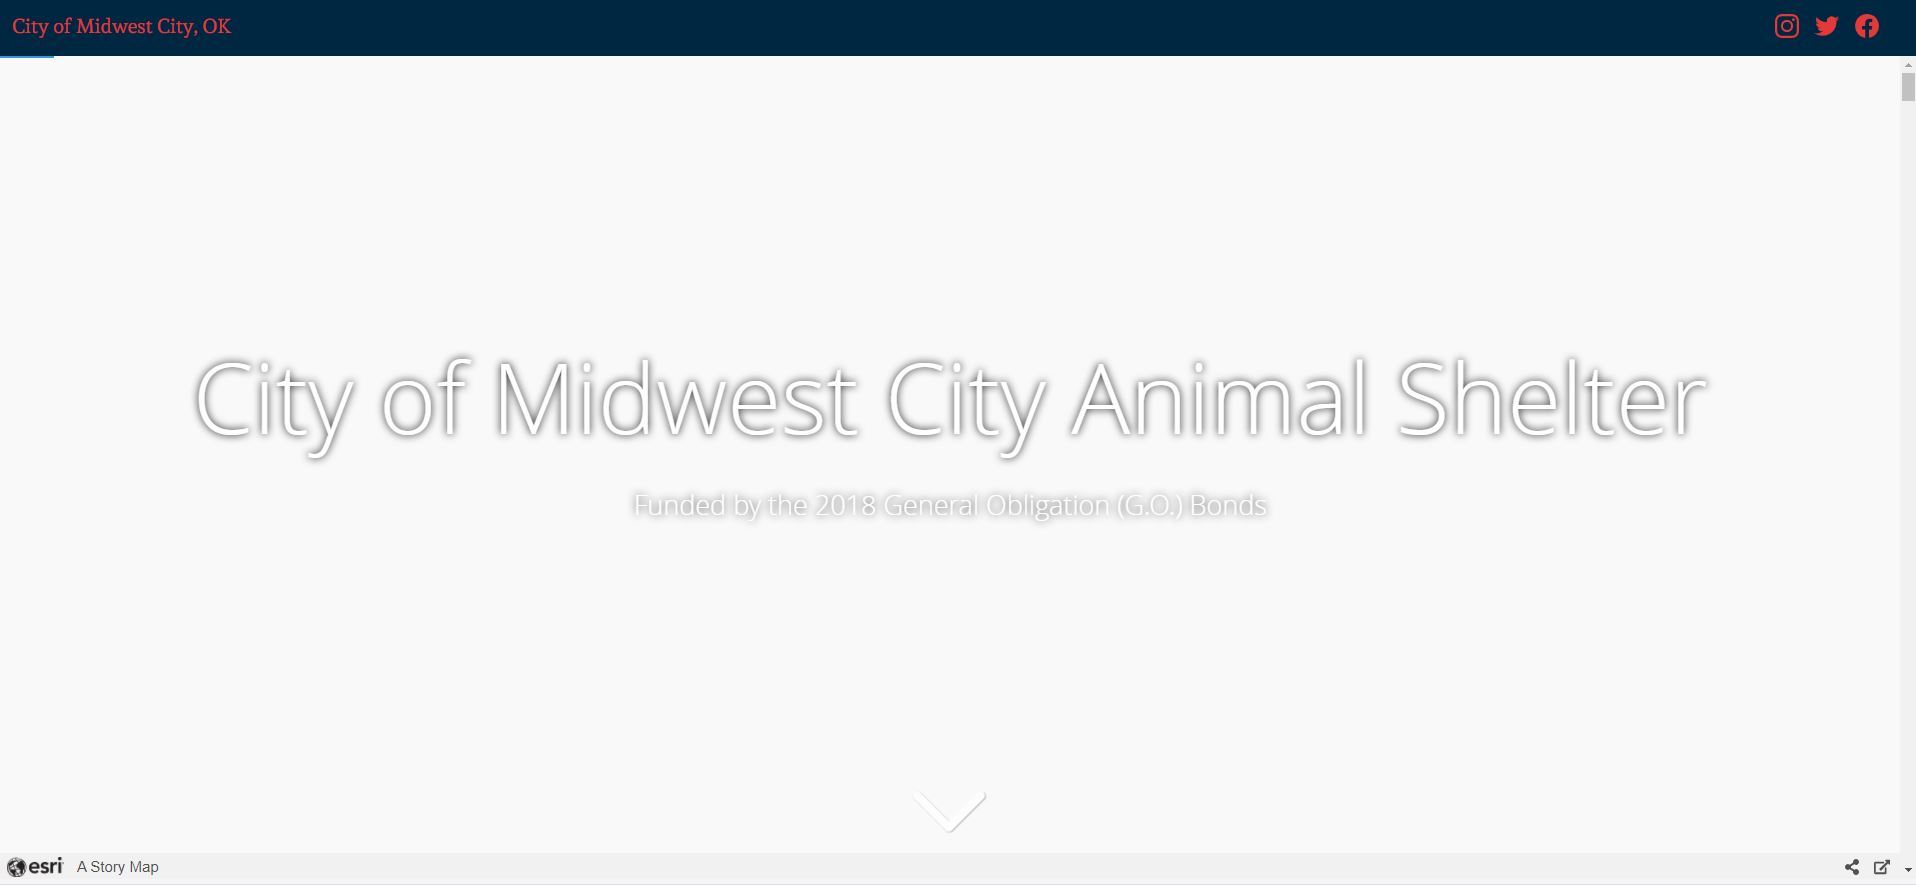
| City of Midwest City Animal Services Center Project Greg Hakman, Bryan Salsieder City of Midwest City, OK The Animal Services Center project was a 2018 GO Bond funded project. This story map takes viewers through the conceptual layout and design of the center, construction updates through pictures, and drone video footage of the progress.
|
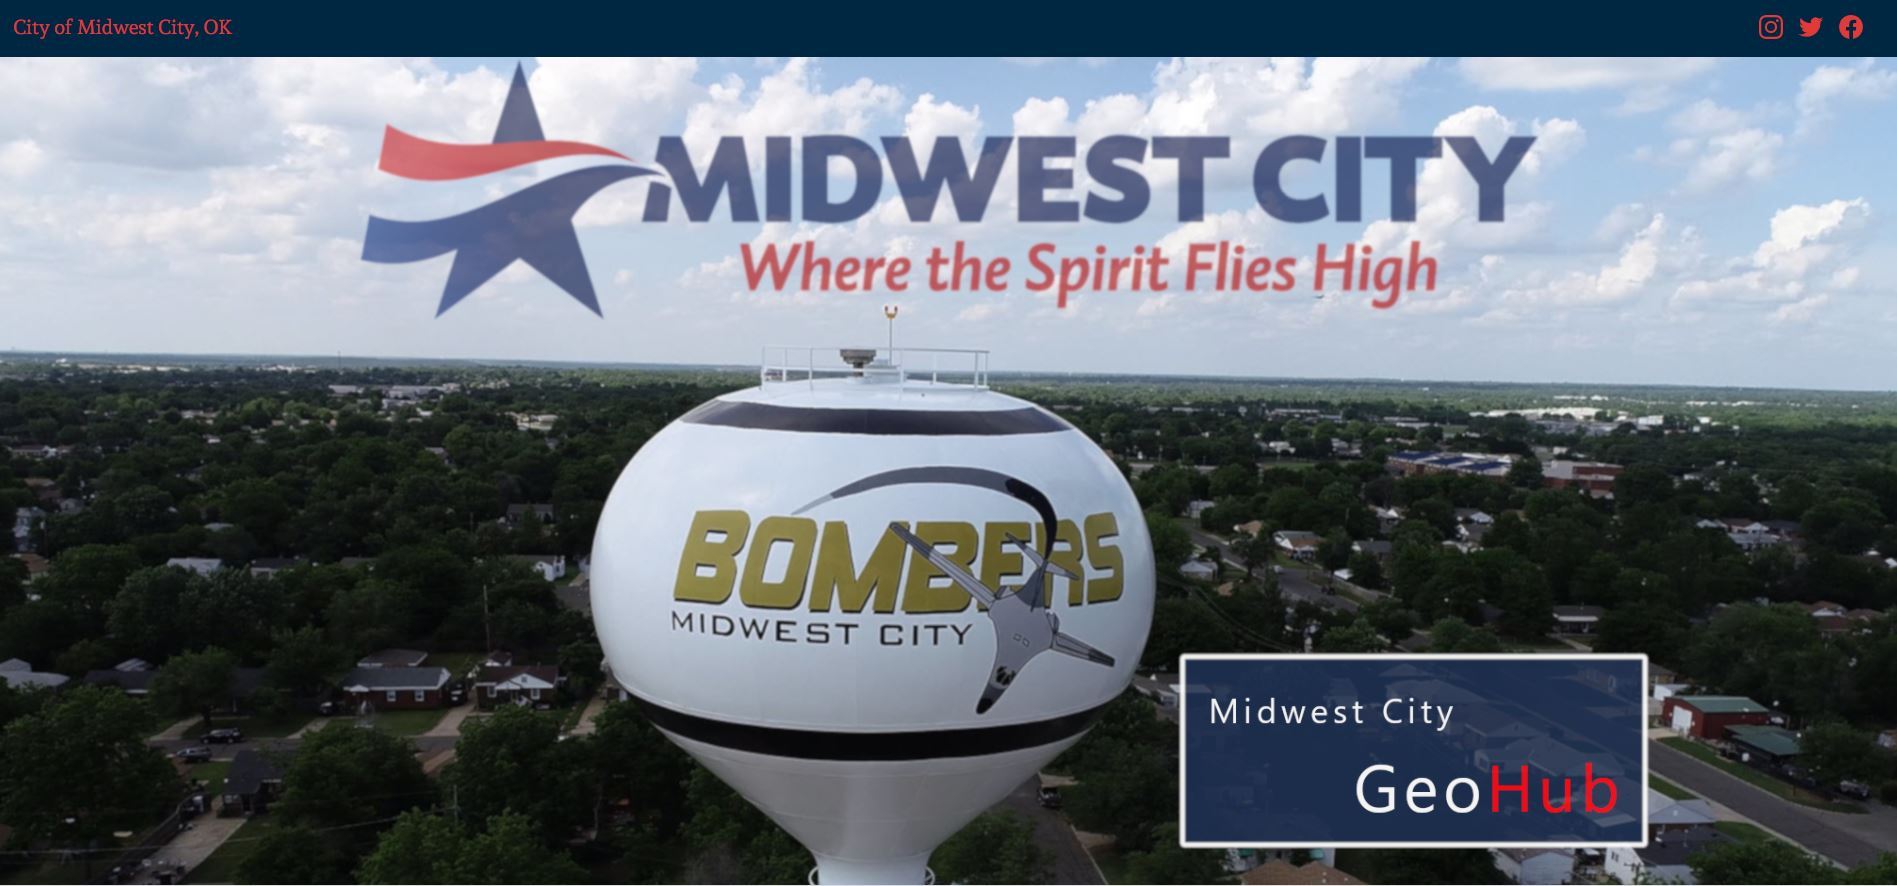
Greg Hakman, Bryan Salsieder City of Midwest City, OK The City of Midwest City's GeoHub is a one stop shop for web maps, Story Maps, Open Data, and a Contractor's section with maps showing contours and the infrastructure atlas map grid.
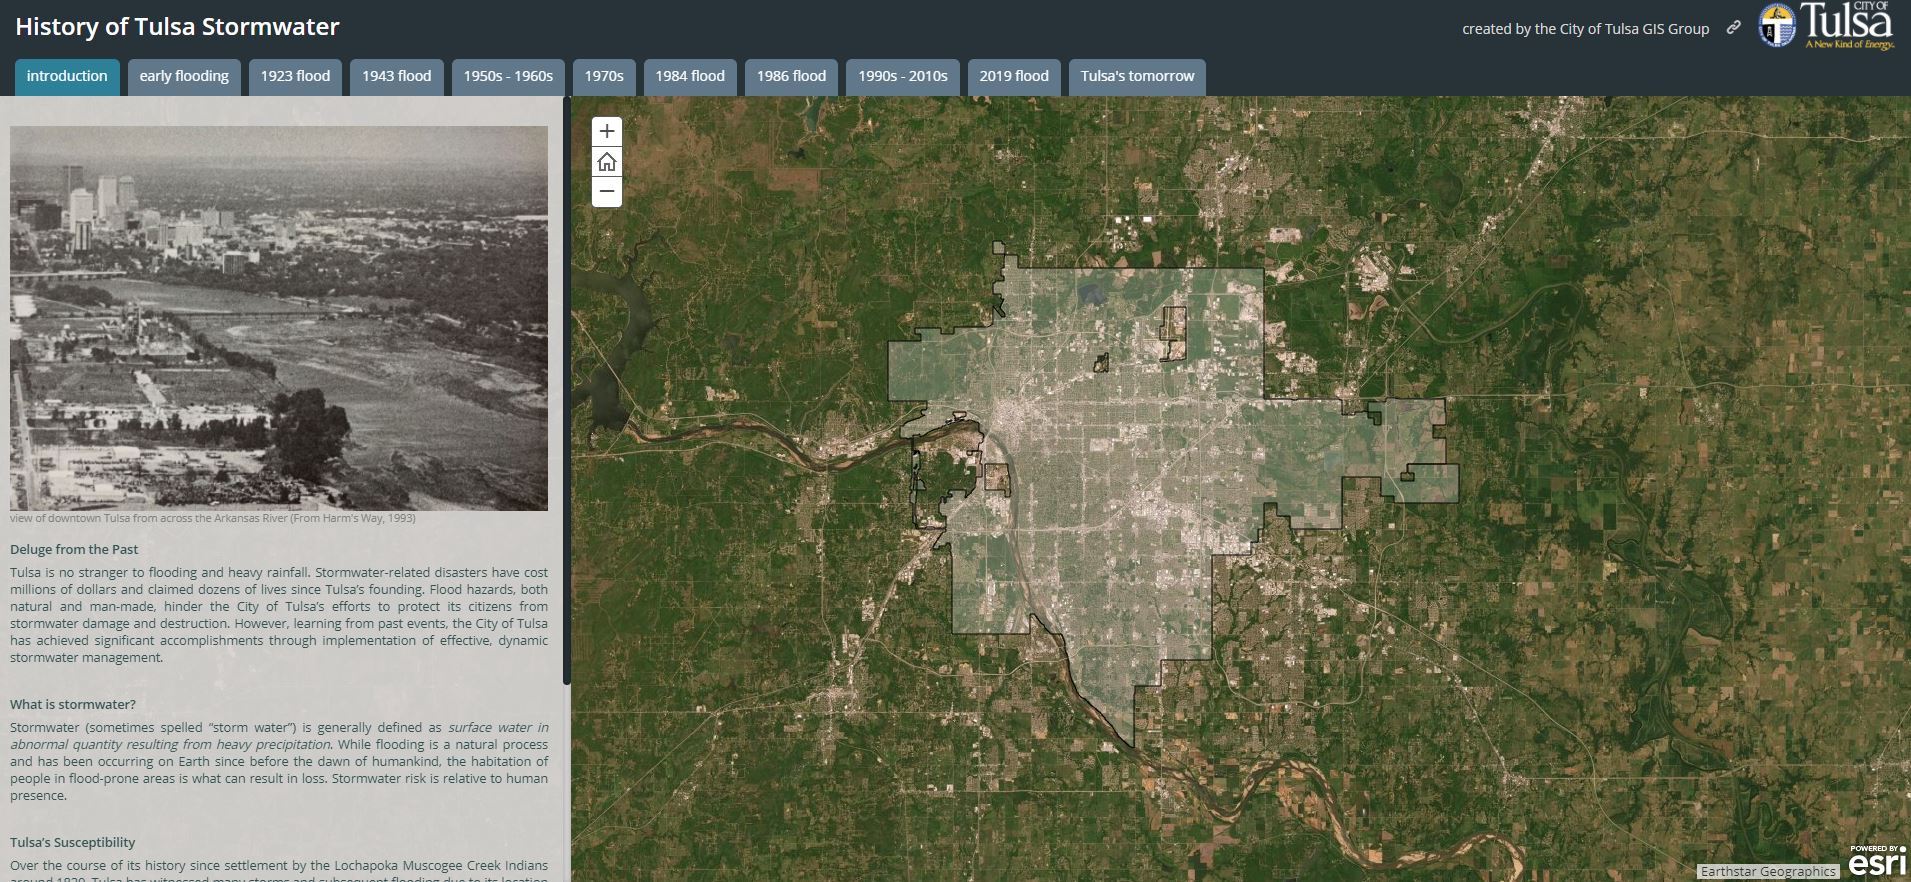
| Chaya Balsiger City of Tulsa GIS Services Tulsa is known for having one of the best stormwater systems in the nation. With each historic flood, the Tulsa stormwater system was needing to evolve and become better. The City of Tulsa Stormwater group worked hard and continues to work hard to prevent floods from causing devastation to Tulsa. The History of Tulsa Stormwater story map gives background information on flooding that occurred in Tulsa from the early 1900s to present day. The story map explains the destruction that happened during each flood and includes maps and images.
| Oilfield and Gas Station Brownfields... Who Are You Going to Call? Madeline Dillner Oklahoma Corporation Commission Brownfield Program The Oklahoma Corporation Agency has two EPA Brownfield Grants that allow them to help cities, counties, nonprofits, quasi-governmental entities, and development entities conduct environmental site assessments and cleanups at brownfield properties affected by oil and gas exploration and production, gas stations, and pipelines. One grant created the program in 2007 and pays for site assessments sanctioned by nonprofits, cities, and counties, and the other grant, brand new as of 2020, is an Assessment Grant won especially to address a corridor of abandoned gas stations in Okemah, OK. Learn more about the program itself in this mother-of-all Story Maps, which contains over 40 embedded Story Maps and apps. Note: Madeline is an OKSCAUG Steering Committee member and is not eligible to win, but she loves her job and is proud of the products her program has created!
|
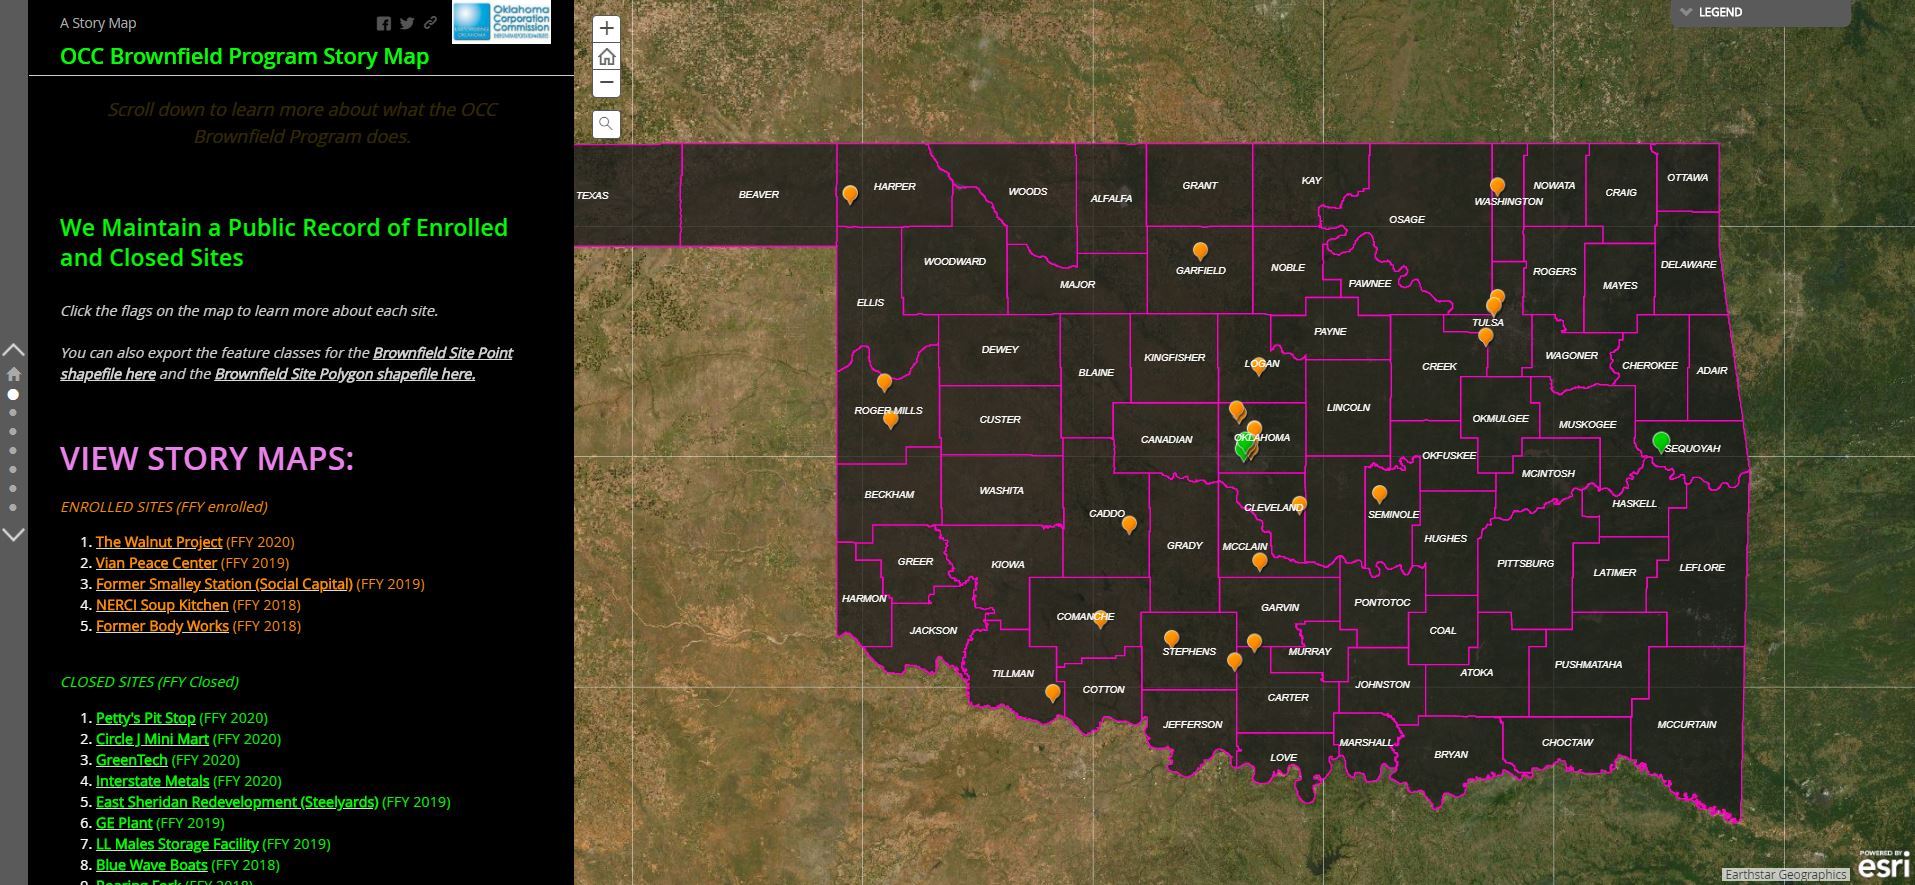
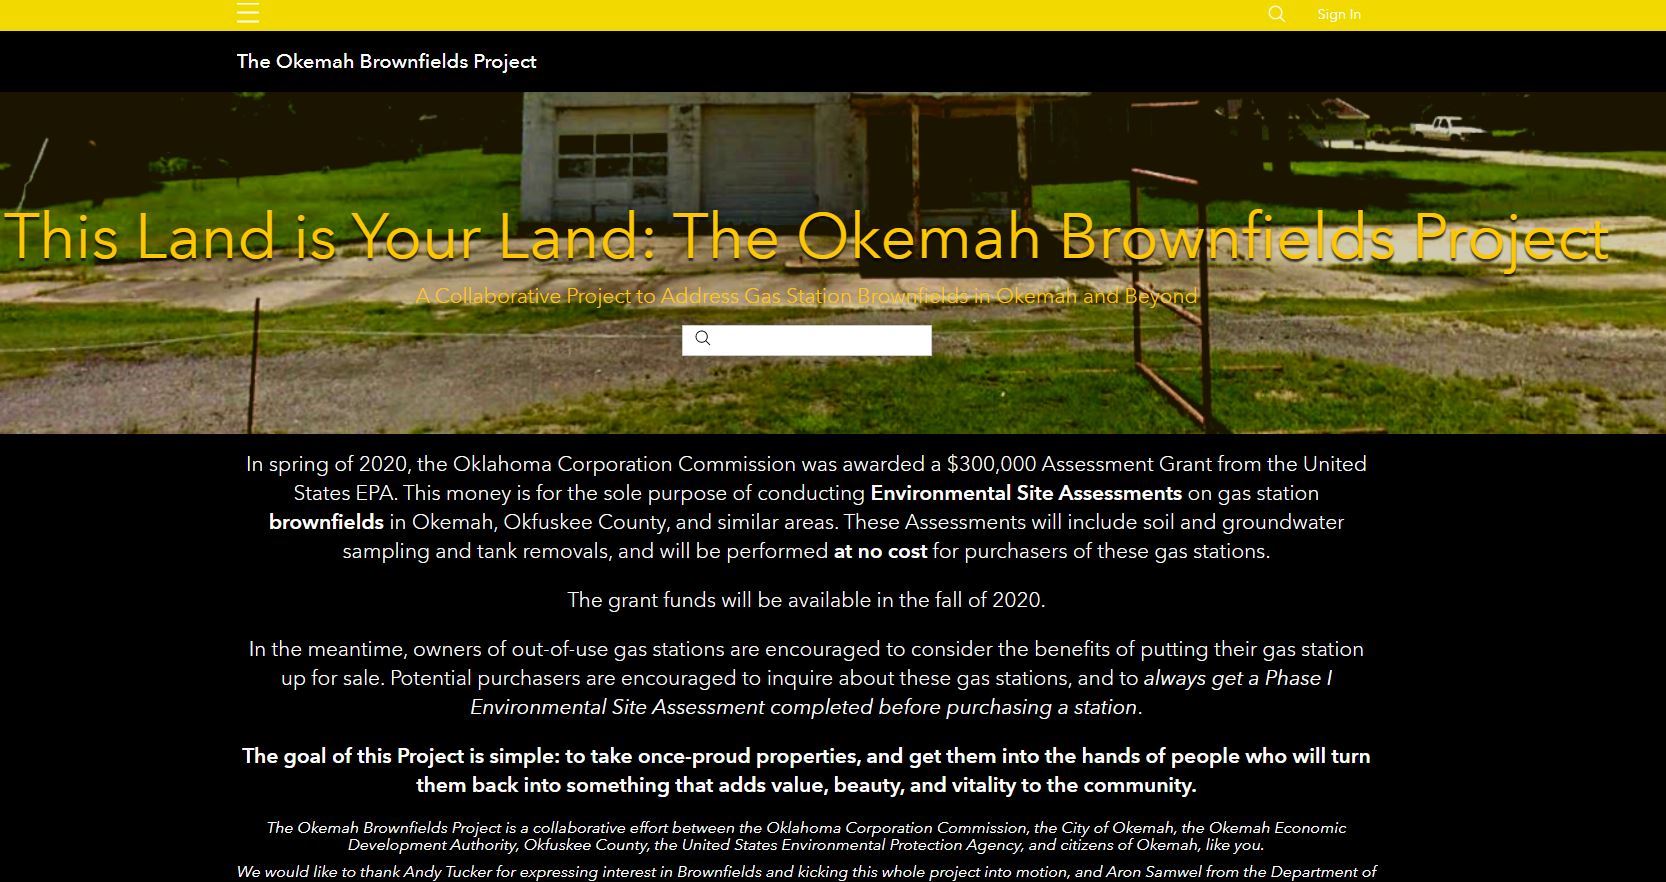
This Land is Your Land: The Okemah Brownfields Project Hub Madeline Dillner Oklahoma Corporation Commission Brownfield Program The OCC Brownfield Program recently applied for and won a $300,000 EPA Assessment Grant to conduct environmental site assessments along a corridor of abandoned gas stations in Okemah, OK. This Hub site was created as a landing page for interested citizens in the City of Okemah to explain the project and how they could get involved. Note: Madeline is an OKSCAUG Steering Committee member and is not eligible to win, but she loves her job and is proud of the products her program has created!
| The Oklahoma Historical Aerial Digitization Project Story Map Madeline Dillner Oklahoma Corporation Commission Brownfield Program The Oklahoma Historical Aerial Digitization Project (OHADP) started in 2007 as the Archival Photo Imaging Project, a Special Project in the Underground Injection Control (UIC) Department of the Corporation Commission. Today, the project is funded alternately by UIC and Brownfields. We have gathered and scanned hard copies of aerial photos from the Oklahoma Department of Libraries, the Oklahoma Department of Environmental Quality, and the Oklahoma Geological Survey. We currently have photos scanned and georeferenced from 1937 to the 1980s. This Story Map is open to the public and has been accessed 594 times in the past year. Note: Madeline is an OKSCAUG Steering Committee member and is not eligible to win, but she loves her job and is proud of the products her program has created!
| Colin Brooks Oklahoma Corporation Commission Induced Seismicity Department The following interactive presentation contains the Oklahoma Corporation Commission's ("OCC") response to induced seismicity ("IS") in Oklahoma.
|
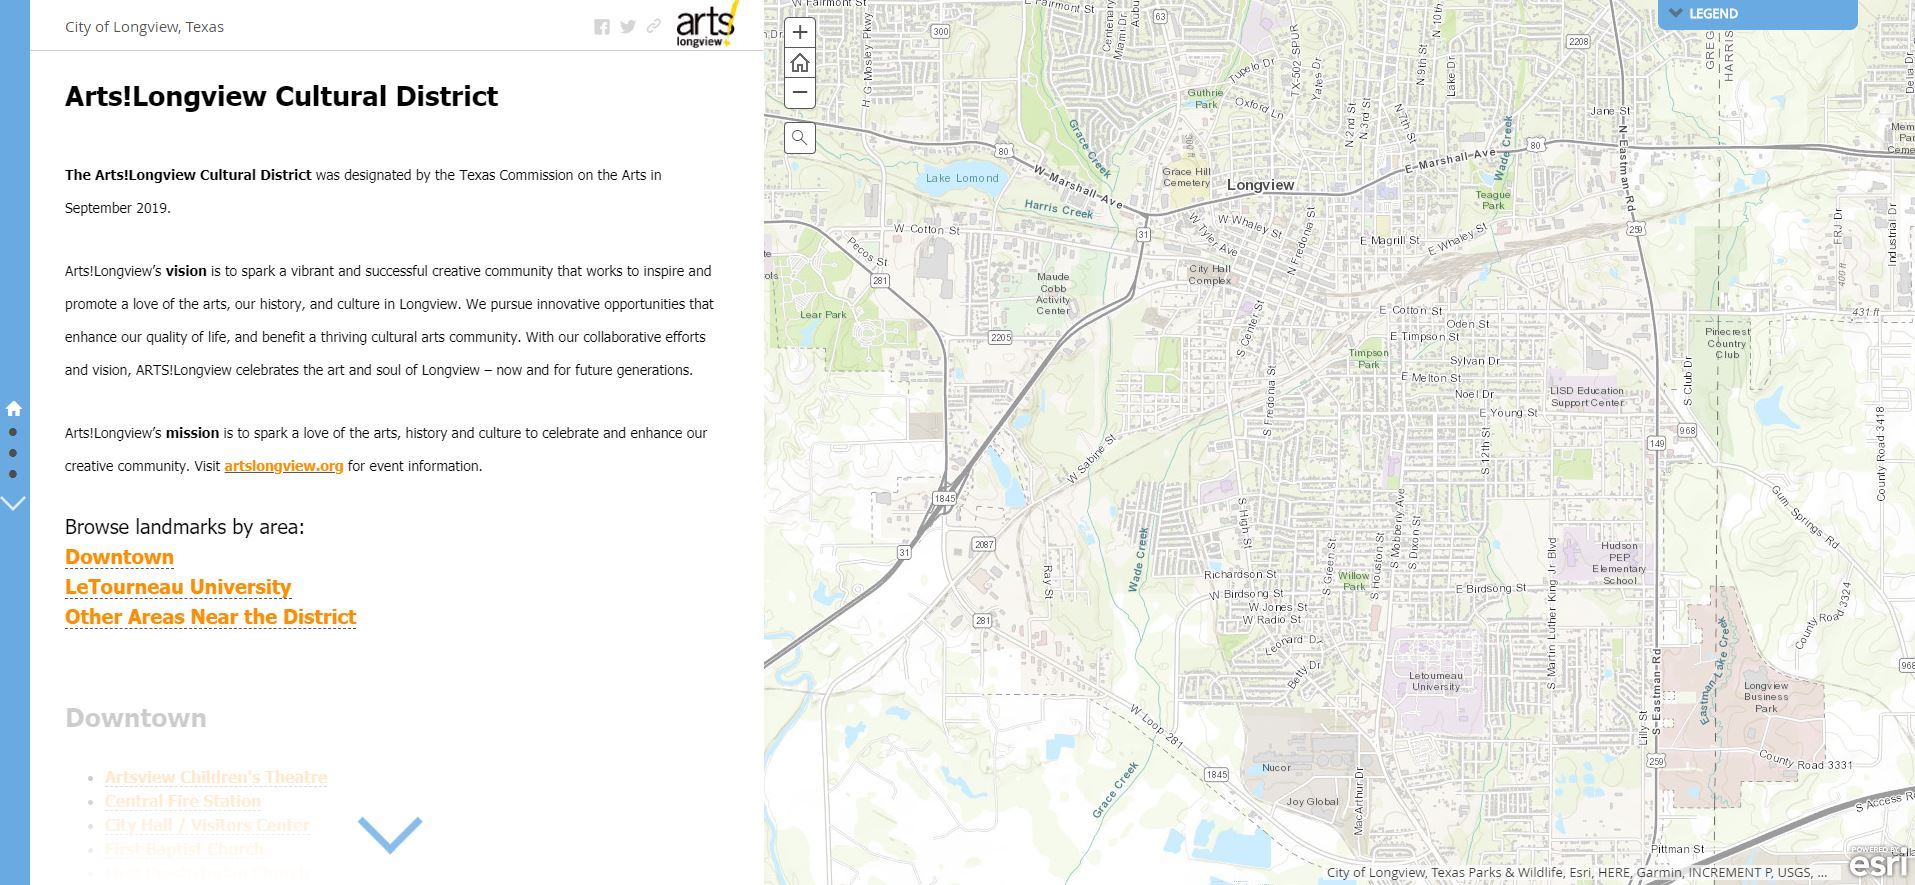
Arts Longview Cultural District Marcus Arreguin City of Longview, TX The Arts Longview Cultural District story map shows the newly created cultural district of Longview, Texas. The district was designated by the Texas Commission on the Arts in September 2019. This app was included as part of a grant application this summer. The Arts District secured a $70,000 matching grant that will be used to produce and install decorative light pole banners, utility box wrappers, street sign toppers, murals, and entryway monuments throughout the cultural district. This app shows visitors the locations of attractions and includes links to associated websites. Attractions include arts venues, churches, educational facilities, historic buildings, museums, parks, and public facilities. As you scroll through the story map, it zooms to specific areas of the district in the map pane and shows lists of attractions in the sidebar.
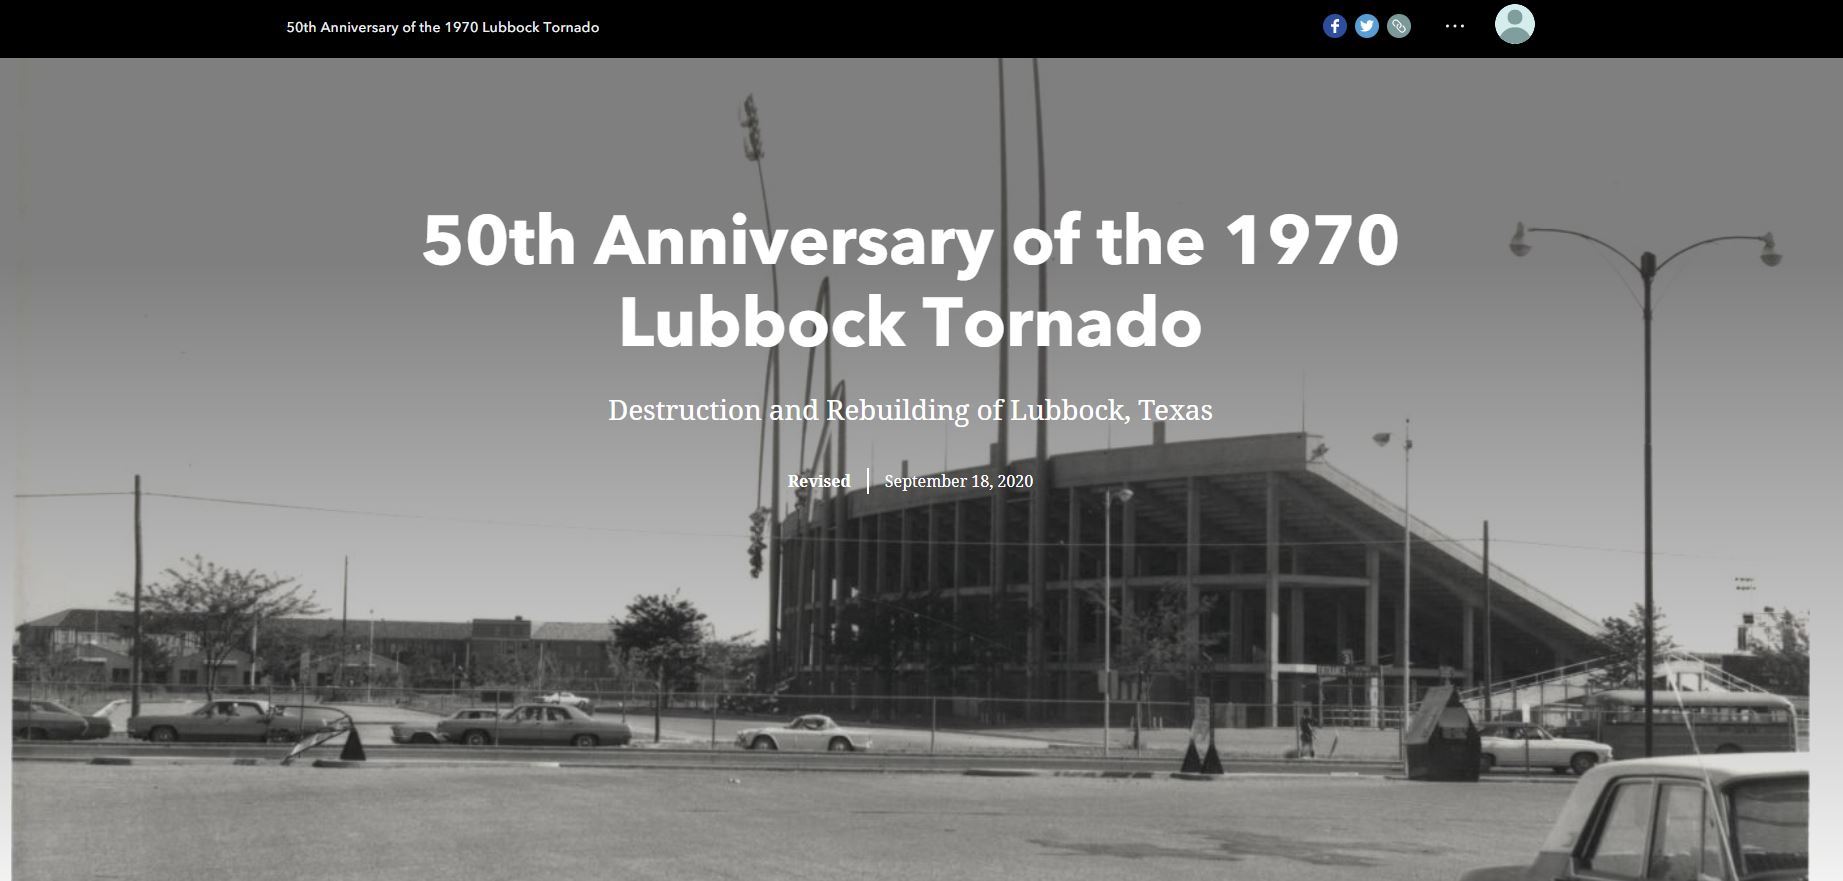
| 50th Anniversary of the 1970 Lubbock Tornado Sarah and Motel Fox, Sean Curran, and Michael Boyles City of Lubbock, TX The history of the 1970 Lubbock Tornado. Includes narratives of several individual experiences, locations of their stories, paths of the tornado, and the locations of the victims. Present day imagery compares in stark contrast to aerial imagery taken 3 days after the storm.
|
Contact SCAUG at : Webmaster@scaug.org | South Central Arc Users Group P.O. Box 96 Ardmore, OK 73402 |